FROM THE EDITOR

We’ve been overwhelmed by the response from the industry to the launch issue of Utility. We set out to create a magazine that was by the industry, for the industry - and if the response received to date is any measure, then we have succeeded.
We’ve heard from readers across all disciplines including energy, water and communications, across various job levels including general managers, engineers and technicians, and across all types of company including utilities, consulting engineers and contractors.
What has amazed us the most here at Utility is how consistent the feedback has been – nearly everyone we’ve heard from has said the same thing: “It’s the first trade magazine I’ve actually read right through!”
The editorial team here at Utility have worked hard to find issues that people in the industry actually want to read about and we’re delighted to hear it is working. Please keep us up-to-date with your suggestions as to what you would like to read more of.
I’d like to share a few statistics with you that have come up since our launch:
• So far we’ve had over 7,000 unique visitors to our website, with over 25,000 pageviews;
• The digital edition has been read online over 6,000 times;
• Over 5,000 print copies were mailed out, and hundreds more people have since subscribed;
• Our email newsletter open rates have been consistently around 60 per cent, compared to an industry average of around 13 per cent.
Utility is actually the tenth magazine I’ve launched in the last ten years – and I’m delighted to say it has been my most successful launch yet.
If this second issue has a theme, then it is information – both how it is gathered, and more importantly, how to understand and use it. We look at some of the tools that have improved the collection of information in the utility sector, whether they are smart meters or mapping tools. We also examine the systems that make sense of this information and, ultimately, how it is used to create smarter grids and networks.
P: (03) 9440 5721
F: (03) 8456 6720
monkeymedia.net.au
info@monkeymedia.net.au
utilitymagazine.com.au
info@utilitymagazine.com.au
Editorial: Michelle Goldsmith
Sales: Cynthia Lim
Design: Sandy Noke www.sandynoke.com
ISSN: 2203-2797
Bland Publisher
Editor PS. As many of you will know, our website is updated with news stories every day, and we send a free email newsletter to subscribers. If you want to keep up-to-date with the latest news, please go online to www.utilitymagazine.com.au today and click subscribe.
Monkey Media Enterprises ABN: 36 426 734 954 GPO Box 93, Melbourne VIC 3001
Published by May 2014 ISSUE 2
Chris
and
welcome


4 UTILITY • MAY 2014 WWW.UTILITYMAGAZINE.COM.AU CONTENTS 10 20 28 54 72 62 ENERGY NETWORKS The way Australian consumers use electricity is changing, and all indications suggest that it will continue into the future. As consumer behaviour evolves, so too must the energy sector, shaping the face of Australia’s future energy grid. SMART METERS Rolling out a smarter network .... 20 In Victoria, the smart meter rollout is now more than 98 per cent complete. How to sell smart meters to consumers 22 By Cameron O’Reilly, Chief Executive of the Energy Retailers Association of Australia (ERAA). The emerging battle for the customer relationship 24 By Kristian Handberg, Principal Consultant, Percepscion. WATER EFFICIENCY Water efficiency in focus ............. 28 By the Water Services Association of Australia (WSAA). Meeting extreme demand 36 The October 2013 bushfires stretched water demand to the limit. Sydney Water was well prepared. Digital water meters 40 Innovation for the future of the water industry. NBN The race to the basement: how FTTB technology could change the face of the NBN ........ 54 Surveying the broadband superhighway at road speeds 58 GIS/MAPPING The evolution of GIS .................... 62 ERP mobility: enabling the spatial enterprise 67 PROJECTS Right route finally found for Lockyer Valley ......................... 72 Collaborative approach sees flood project completed 74 i Pricing policies in need of review, by Peter Dobney, Orora 16 OPINION


5 WWW.UTILITYMAGAZINE.COM.AU UTILITY • MAY 2014 44 48 52 COAL SEAM GAS Pilliga update: the Narrabri Gas Project .............. 52 The proposed Narrabri Gas Project located in North-West NSW will be Santos’ first large-scale project in the state.
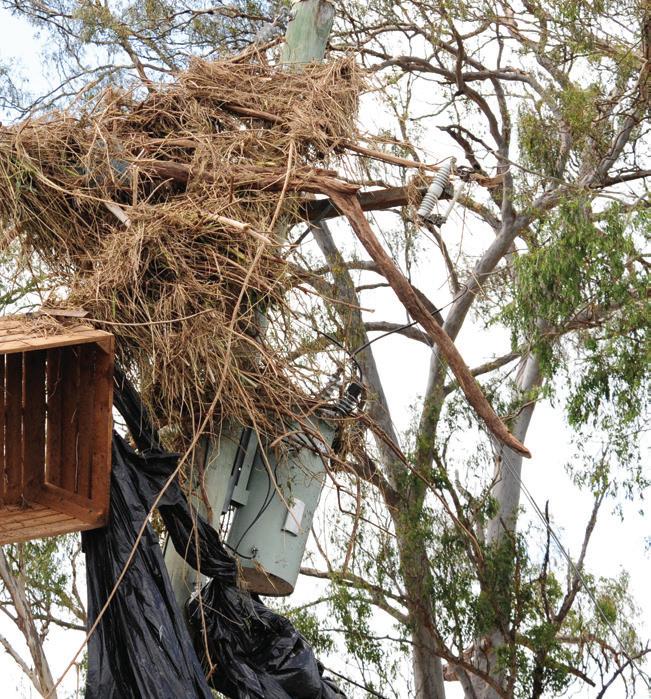
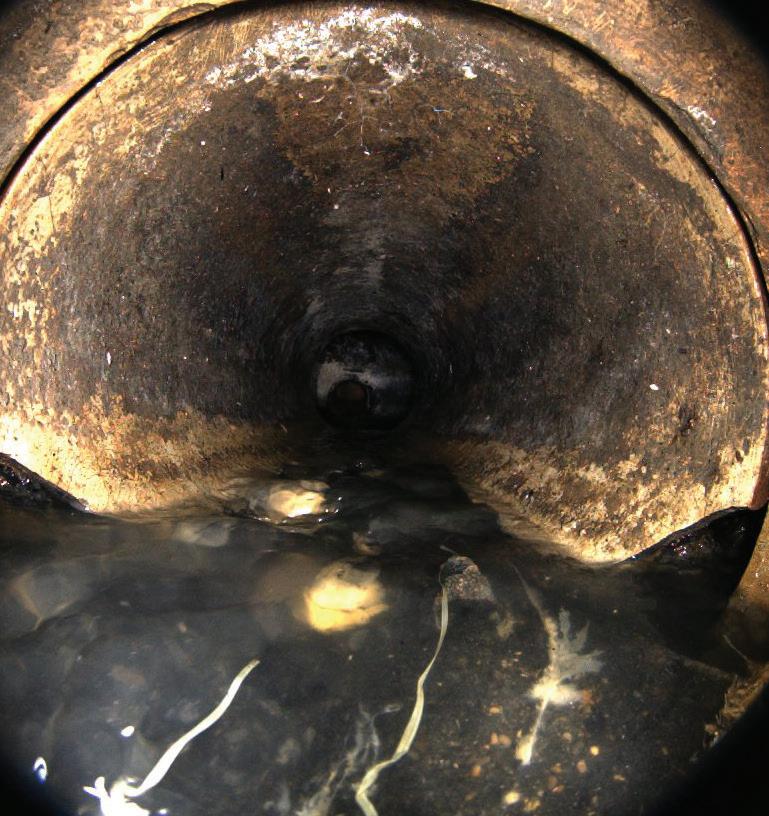
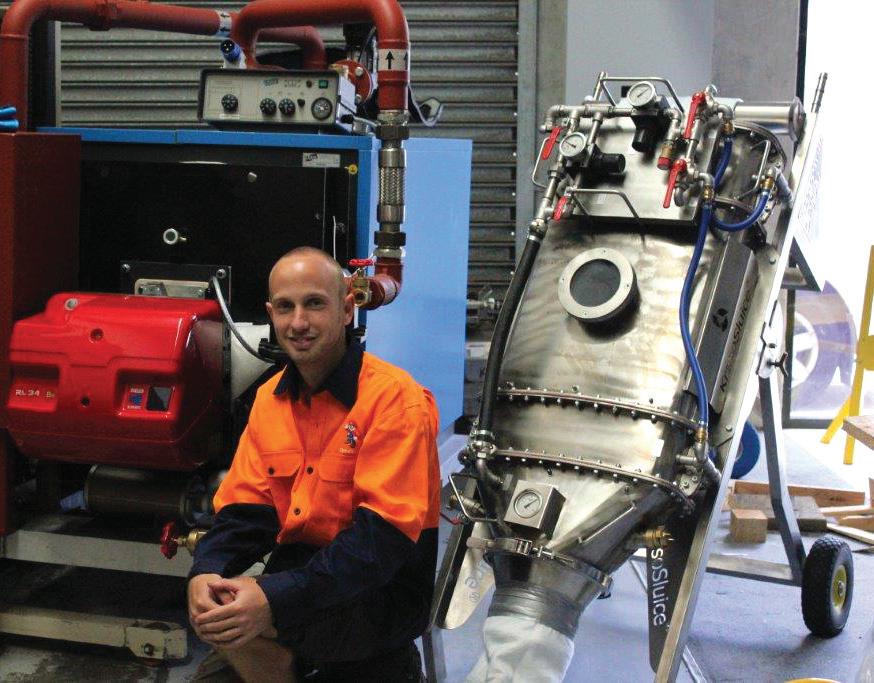
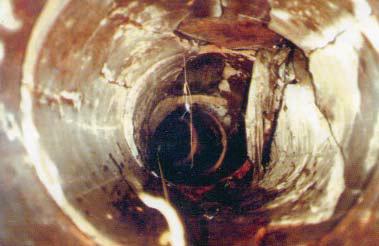
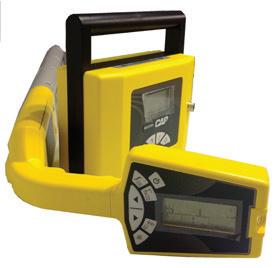
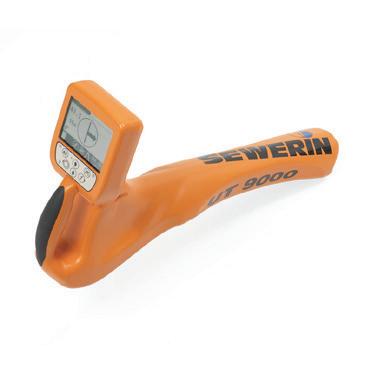
ASSESSMENT Lifting the lid on drain surveying technology 46 How technology is giving utilities a clearer picture than ever before as to just what condition their assets are in.
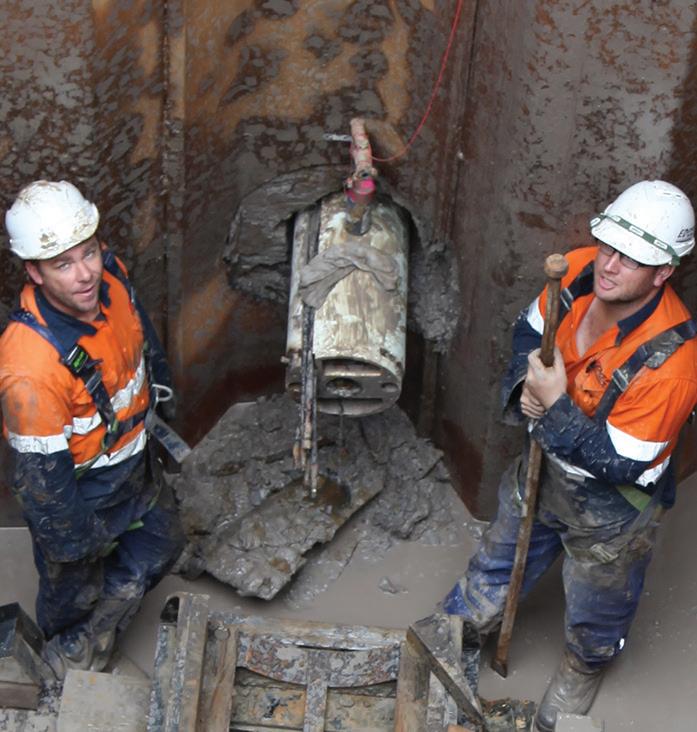
Keyhole precision: Trenchless pipeline installation in changing ground conditions 48 The Woolloongabba Sewer Capacity Upgrade is a major project currently being undertaken by Queensland Urban Utilities to increase the capacity o to cater for this growth. Cable tunnels under Sydney 50 A tunnel under Sydney’s CBD is a critical component in future-proofing the city’s electricity supply network. Water Corporation of Western Australia......................... 76 We get up close and personal with a water utility with one of the largest areas of coverage in the world. In each issue Editor’s welcome .................................................. 1 News briefs ........................................................... 6 A word from the ENA ........................................ 18 Product showcase .............................................. 78 Advertisers’ index .............................................. 80 Editorial schedule .............................................. 80 May 2014 ISSUE 2 Utility magazine is bringing together experts on various fields to answer all your questions UTILITY IN PROFILE 76 70
INSPECTION/CCTV/CONDITION
MICROTUNNELLING
COMDAIN INFRASTRUCTURE SECURES $485M IN LONGTERM CONTRACTS
Over the past twelve months, national infrastructure company Comdain Infrastructure has secured $485 million of contracts in the water and gas sectors.
Established in 1962, Comdain Infrastructure is a dynamic organisation with an enviable reputation for being a leading infrastructure design, construction and operations/maintenance services business specialising in the water, irrigation and gas sectors.
Comdain’s status as a market leader in project delivery has been enhanced through recent appointments to South East Water’s five-year Pipes and Structures panel (through its leadership of the joint venture with Downer EDI and MWH) and Sydney Water’s 5-year
Network & Facility Renewals Program. The latter contract has seen it establish its NSW operations in the Sydney area.
Building on its impeccable credentials in Operations and Maintenance (O&M), its award of the Multinet Gas five-year Network Operations and Maintenance contract and the renewal of its 17year (for a further 5-years) APA Group O&M contract sees Comdain Infrastructure managing over one third of the Melbourne gas distribution network.
With a strong focus on continuous improvement in delivering lower total
CONSTRUCTION COMPANY ACQUIRES UNDERGROUND UTILITY SPECIALIST
Construction company Seymour Whyte will acquire Rob Carr Pty Ltd, a privately owned, civil construction business specialising in underground utilities services.
It is hoped the acquisition will create significant growth opportunities for the combined business through mutually beneficial platforms into new regions, new sectors, expanded product offerings and bigger projects.
Seymour Whyte Managing Director David McAdam said the acquisition aligns with Seymour Whyte’s strategic vision to expand its geographic footprint, diversify into the utilities sector and enhance technical capability.
“Seymour Whyte reviewed more than 50 potential acquisition targets before proceeding with Rob Carr Pty Ltd. This is an exciting business that provides a range of new growth opportunities, and offers a strong alignment of operating cultures and professional competencies,” he said.
“Seymour Whyte’s first acquisition will take us to where we want to be in the water and power utilities market. It will increase quality of earnings, and increase technical expertise in the growing micro-tunnelling market.”
NSW GAS PIPELINE ANNOUNCED
AGL has announced the construction of a 95 kilometre underground, natural gas pipeline linking Gloucester to the Newcastle area.
The underground pipeline will transport gas between Stratford, near Gloucester, and the existing Sydney-Newcastle gas pipeline via AGL’s Newcastle Gas Storage Facility located at Tomago, which is currently under construction.
The pipeline could be transporting more than 15 per cent of the state’s gas needs by 2018.
AGL’s General Manager Commercial Development in Upstream Gas, Paul Ashby, said in order to build the pipeline, land access was needed. Following five years of extensive
cost of ownership for the benefit of all stakeholders including asset owners, managers and end customers, Comdain CEO Peter Coen commented: “With a strong presence across Australia’s eastern seaboard we focus strongly on developing and maintaining long term relationships with our clients. We are deliberately focused on having end-toend capability in our areas of expertise, and our capability is demonstrated by our track record of achievement and it is underpinned by the commitment and professionalism of our people.”
POWER AND WATER CORPORATION TO BE RESTRUCTURED
The NT Government has announced that the Power and Water Corporation (PWC) will be restructured to become two new stand-alone, government-owned corporations with separate boards.
The Deputy Chief Minister David Tollner has met with the new PWC Board to discuss a governance and implementation framework to guide the PWC reforms. The new corporations will be for electricity retail and generation, and will come into effect from July.
The NT Government says that this approach will be able to drive efficiency through more effective structures in a competitive environment.
negotiations, AGL has access and compensation agreements in place for 146 properties along the pipeline route and agreements remain outstanding for only a handful of properties.
“The pipeline will be buried and once construction is completed, disturbed land will be rehabilitated and afterwards can be used for grazing and shallow cropping,” he said.
AGL has already received the required State and Federal environmental approvals to construct the pipeline.
Pipeline construction is expected to commence in early 2015 along the route between Stratford and the Newcastle Gas Storage Facility at Tomago.
UTILITY • MAY 2014 WWW.UTILITYMAGAZINE.COM.AU 6 NEWS gas
NEED PIPES AND DRAINS REPAIRED NOW?
Streamline is structured to respond to your needs with a sense of urgency We can get it done in days, not months
WE SPECIALISE IN PROVIDING FAST AND QUALITY SERVICE TO LINE SMALL AND LARGE DIAMETER STORMWATER, SEWER AND TRADE-WASTE LINES FROM 90MM TO 1.2 METRE DIAMETER
The Benefits of Streamlined Pipes
■ 20 years experience in Lining Sydney Pipes.
■ Provide EPA & Council Solutions
■ Environmental Award Winning.
■ Domestic-Commercial-Industrial Solutions
Streamline has been serving the Sydney market for over twenty years, providing solutions to domestic, commercial and council markets. We focus on the urgent jobs, which means we are always available when you need us.
■ Latest Equip/Technology to provide the best solution
■ Permanent solution & ready to use in hours
■ Streamlines patented adhesive system is guaranteed not to leak
Customers include Melbourne zoo seal pool, Ku-ring-gai, Manly, Pittwater, Camden, Fairfield, Villawood, Woollahra and Strathfield City Councils, McDonalds, Kraft, Sanitarium and ABB World


Gold
Winners
system won the International Gold Medal at Geneva Switzerland
Medal
Streamlines Patented
BEFORE AFTER This badly damaged pipe can be relined by The Streamline Team The Streamline lining system will have this pipe better than if brand new Lic 165253C CALL US FIRST - When you need a quick turnaround email: info@streamlinepipes.com.au www.streamlinepipes.com.au 1300 550 447
LATEST HOT-CURE SLUICE TECHNOLOGY OUR NEW 1 Million BTU BOILER MEANS YOUR JOB IS DONE MORE EFFICIENTLY
HUNTER WATER TO SELL HEADQUARTERS FOR WASTEWATER FUNDS
Hunter Water’s iconic head office at Honeysuckle, NSW will be sold to help fund a likely multimillion dollar upgrade to Burwood Beach Wastewater Treatment Plant as it prepares for an increase of up to 20,000 customers over the next two decades.
The Plant is the largest in the Lower Hunter, treating the wastewater for approximately 190,000 people from Newcastle and parts of Lake Macquarie. However, government forecasting shows the population serviced by the Plant will increase by up to 20,000 people over the next 20 years.
Hunter Water Managing Director Kim Wood said the decision to sell the head office would help offset the cost of the upgrade at Burwood Beach.
“Hunter Water will spend $435 million on capital works across the Lower Hunter over the next four years. This will be achieved while keeping water prices
in line with inflation only. To do this, while minimising new borrowings and ensuring financial sustainability, requires Hunter Water to dispose of non-core assets such as the head office and a number of landholdings in the Dungog region previously bought for the now defunct Tillegra Dam.
“Hunter Water’s head office is a stunning piece of architecture and was the first in Newcastle to receive a 4-star Australian Building Greenhouse Rating for its water and energy efficient initiatives.
“The property will go on the market with a condition that Hunter Water has a 10 year lease with an option for a further 5 years. The combination of the quality of the building, a long-term tenancy and the Government’s decision to end the train line at Wickham will, I expect, ensure strong interest.”
MERGER TO FORM NEW WATER PROVIDER FOR NSW
The NSW Government has announced that it will consolidate the Sydney Catchment Authority (SCA) with the State Water Corporation to form Bulk Water NSW, a new service provider for the NSW water sector.
NSW Minister for Primary Industries Katrina Hodgkinson said that the integration is expected to take up to 18 months, and the decision was informed by the findings of Stage 1 of the 2013 independent Bulk Water Delivery Review.
“By uniting water quality, dam management, flood mitigation and catchment-management skills and expertise, this new stronger organisation will ensure the highest quality and most efficient service to customers across NSW.
“The new structure will assist the NSW Government to anticipate, plan and react to such environmental issues as drought, flood and water quality.
“This is a logical, practical and overdue reform, which will create opportunities to leverage the combined strengths of these two organisations to deliver improved service delivery and better outcomes for customers.”
Ms Hodgkinson said an interim common Board and Chief Executive Officer will operate across SCA and State Water Corporation during the implementation, with Mr Terry Charlton appointed as the inaugural Chair.

SA WIND PROJECT APPROVED
The SA State Government has given planning approval to the Ceres Project, a $1.5 billion, 197-turbine wind farm development which will be located between Ardrossan and Minlaton on the Yorke Peninsula.
The development has now been approved subject to conditions as a result of consultation with the local community. These conditions relate to the construction and operation of the wind farm and infrastructure such as transformers, transmission lines and cabling.
SA Minister for Planning John Rau said the development will connect to the Adelaide electricity grid via an undersea transmission cable from Port Julia to St Kilda.
“It is estimated that the Ceres wind farm would be able to power the equivalent of 225,000 South Australian homes a year,” Mr Rau said.
“It is envisaged that the development will also generate 500 direct jobs during construction, along with an expected 50 fulltime jobs over the 25-year operational life of the development.”
UTILITY • MAY 2014 WWW.UTILITYMAGAZINE.COM.AU 8
NEWS water/sewer
electricity For the latest UTILITY NEWS visit www.utilitymagazine.com.au
electricity continued...
$100M ELECTRICITY UPGRADE FOR METUNG
SP AusNet is completing an upgrade project to improve the supply of electricity to residents and businesses in the Metung area in East Gippsland, Victoria.
The works are part of SP AusNet’s $100 million project to improve powerlines in various locations within eastern,
FTTB PILOT PLANS UNDERWAY
NBN Co has announced that four telcos have agreed to participate in the company’s fibre-to-the-building (FTTB) pilot in the Melbourne suburbs of Carlton, Parkville and Brunswick.
The companies that have signed up are:
• iiNet
• M2
• Optus
• Telstra
It is estimated that the pilot will run for three months, during which time NBN Co and its telco partners will
central and northern Victoria, and are expected to be completed by December 2014.
SP AusNet Project Manager Abe Friedlander said SP AusNet is committed to the reliability of its electricity network, with this work set to improve
evaluate all aspects of the construction, installation, operation, service performance and the overall customer experience.
NBN Co’s Chief Technology Officer, Gary McLaren, said:
“According to the Strategic Review, up to 12,000 buildings containing around one million individual premises could be served by FTTB. This pilot scheme, and the fibre-to-the-node trials we’re currently scoping, will help us determine the fastest and most cost-effective way to deliver access to high-speed broadband
power supply for around 1,100 local residents in the area.
“Following routine powerline inspections, eight power-poles and approximately 12 kilometres of powerlines in the Metung area were identified for replacement,” Mr Friedlander said.
sooner.
“Retail telcos, local councils, the building owners and tenants are all enthusiastic participants in the process. We are now raring to test the consumer experience along with that of our wholesale customers.”
The company’s Strategic Review, issued in December last year, recommended that the National Broadband Network could be rolled out faster and at a lower cost by combining proven technologies with existing capable networks.


WWW.UTILITYMAGAZINE.COM.AU UTILITY • MAY 2014 9 NEWS
NBN
THE FUTURE IS
N O W
By Michelle Goldsmith
The way Australian consumers use electricity is changing, and all indications suggest that it will continue to do so into the future. As consumer behaviour evolves, so too must the energy sector, shaping the face of Australia’s future energy grid.
ENERGY USE FOR THE FUTURE: MANAGING DEMAND
Demand management features heavily in energy utilities’ preparations for the future grid. Of particular interest are periods of peak demand, such as hot summer days, when energy use is at its highest and the grid is under the greatest pressure. Managing peak demand keeps network utilisation stable and manageable and prevents network

reliability issues. This in turn keeps the cost of electricity to the consumer stable by preventing or delaying the need for capital expenditure on additional infrastructure to cater for periods of high demand and cost stability reduces the likelihood of price hikes associated with scenarios where electricity supply is unable to keep up with electricity demand.
One extensive study into the future
of the Australian grid - the CSIRO Future Grid Forum’s report, Change and Choice, focused on formulating possible alternate scenarios regarding the way Australian consumers will use electricity in the near future and examining the resulting changes to the energy sector for each of these scenarios. The forum concluded that in reality, the future of the Australian energy grid will probably involve aspects of various
UTILITY • MAY 2014 10 ENERGY NETWORKS
The future grid may be closer than we think, with many power utilities already preparing for the future by trialling and adopting new programs and technologies to manage demand.

Various predictions emphasise a variety of possible scenarios for the future grid, emphasising the importance of innovative technologies, consumer choice and demand management.
WWW.UTILITYMAGAZINE.COM.AU UTILITY • MAY 2014 11 ENERGY NETWORKS
The future is now
Responses > 40%
scenarios, including consumers adopting alternative tariffs based on peak demand management.
The Future Grid Forum also predicted an increase in consumer engagement with their energy use in the future and that this would be a key driving factor in shaping the future of the energy sector.
Consumer engagement and participation are vital to demand management, and therefore any demand management program requires understanding of the drivers behind consumer energy demand. This allows for it to be influenced through various means, such as incentives and education.
The following energy utilities have each adopted different programs and conducted various trials to achieve this end.
SP AUSNET: TARIFF INCENTIVES FOR LARGE BUSINESSES
Starting in 2010, SP AusNet has been running a Critical Peak Demand (CPD) program focusing on large businesses.
The program provides SP AusNet’s large business customers (those consuming more than 160MWh of electricity per year) with the incentive
to cut their electricity consumption for four hours on five days of high network demand by calculating their average peak demand on those days to determine the ‘critical peak demand component’ of the businesses’ tariff for the following year. This means that businesses that significantly reduce their energy consumption during the preselected CDP days benefit with reduced energy costs.
In turn, the reduced electricity consumption by these businesses on the CPD days significantly reduces energy demand during the times when the network is under the most pressure.
SP AusNet reflects that the greatest challenge of the program has been making sure customers are aware of, and adequately understand, the CPD program. As the program requires active participation, the more large business customers are aware of it, and understand what it involves, including both the direct and indirect benefits it provides, the greater impact the program will have.
The figures for SP AusNet’s 2012/13 critical peak program showed that 1,333 of the 1,977 businesses
participated, reducing peak demand by 42 MW, the annual peak demand equivalent of 8,500 households. Seven out of ten businesses managed to reduce their demand on the nominated CPD days and 181 large business customers reduced their demand by more than 40 per cent. This represents a significant reduction in demand on the grid during these periods.
Peter Milburn, General Manager at independent energy management consultancy Utilacor, is a strong advocate of the CPD program.
Utilacor’s clients come from a wide range of industries where power use makes up one of a company’s most significant costs, including manufacturing, irrigation, produce growing, food and beverage, wine and cold storage.
“Since the inception of SP AusNet’s Critical Peak Demand program, Utilacor has recognised the benefits available to its clients through active demand response and participation,” says Mr Milburn. “Accordingly, we have actively sought to educate clients on how to benefit from the tariff structure, together with moving businesses to appropriate tariffs to heighten cost reduction.”
UTILITY • MAY 2014 WWW.UTILITYMAGAZINE.COM.AU 12
ENERGY NETWORKS 45.00 40.00 35.00 30.00 25.00 20.00 15.00 10.00 5.00 0.00 MW 12:30 1:30 2:30 3:30 4:30 5:30 6:30 7:30 8:30 9:30 10:30 11:30 12:30 1:30 2:30 3:30 4:30 5:30 6:30 7:30 8:30 9:30 10:30 11:30 AM PM
CONSUMPTION PROFILE OF THE 181 BUSINESSES THAT HAD A 40 PER CENT PLUS REDUCTION IN PEAK DEMAND DURING SP AUSNET’S PROGRAM
“Our kWatch system and expert staff assess the incentives and benefits offered by the program so that large energy users appreciate the opportunity made available to them by SP AusNet’s CPD program; though we also ensure that they are appropriately equipped with strategies, technology or operational tools to maximise realisation of the incentive offered.
“Utilacor has also found that in addition to the financial benefit achieved, customers become engaged in active energy management and start to truly understand the triggers that drive their billing and costs resulting in cost reduction achieved in other ways,” he says.
“Utilacor continues to promote and educate the Critical Peak Demand program to more and more customers, and has a team of experts to assist customers appropriately engage in the program.
“We remain strong advocates of the Critical Peak Demand program offered by SP AusNet, appreciating that it offers benefit to both large energy users and SP AusNet through appropriate response to network demand constraints.”
UNITED ENERGY: VOLUNTARY PEAK DEMAND TRIALS FOR HOUSEHOLDS
Early this year United Energy began a voluntary peak demand management trial called the Summer Energy Demand Trial. This program aimed to investigate the impact of households voluntarily trying to reduce their energy consumption during peak demand periods by analysing participating households’ smart-meter data. The rationale behind this trial was that small changes in energy use may have a large impact if widely adopted.
The test area, Bulleen/Lower Templestowe in Victoria’s eastern suburbs, was chosen because the network infrastructure for the area will require around $1million of upgrades to meet demand within the next three years if demand increases as expected.
Participants were also able to view their own results via an online portal, and those who reduced their demand received incentives for each event day.
The first trial showed extremely promising results. Thirteen households participated in the pilot program and a total of one event day was held. During the set periods there was a 32 per cent reduction of demand across participating households as compared to similar 35-40OC days. One customer even managed to reduce their peak demand by 66 per cent.
Customer feedback suggested that the web portal was an important factor in the results, as customers got a feeling of control and satisfaction from viewing their results and competing with the other participating households.
A spokesperson from United Energy said the results were “remarkable” and the reductions were “far beyond expectations”.
United Energy states that the greatest challenge in this trial has been, and will be, making the trial known to customers – building confidence and truly engaging with customers so they not only accept the trial, but actively want to take part.
Responses from participants of the first trial were positive. One participant said the event was “easy” and that she would readily have done it for longer than required.
United Energy intends to continue running the trial over three years. All indications suggest the program is increasing in popularity. It looks set to be adopted on a much wider scale next summer with over 50 households already having signed up to participate.
United Energy considered the pilot results “a sign of things to come” and intends to consider the data gained
over the three years when formulating possible demand management programs for the future.
TRANSGRID: HYBRID ENERGY SYSTEMS AND PEAK DEMAND RESPONSE
TransGrid, the company responsible for the high voltage electricity network in New South Wales, has invested in a number of successful demand management and response programs.
TransGrid, in collaboration with demand response provider EnerNOC, claimed the top award in the Best Demand Response category of the 2013 Energy Efficiency Council Awards, for a peak demand management initiative which involved more than 80 sites across Sydney. The project, which encouraged users to shift consumption outside peak periods, saw an average usage reduction of 600kW per site.
EnerNOC is a leading provider of energy intelligence software and related solutions for demand-side management.
“Our strong partnership with EnerNOC made it possible for TransGrid to leverage existing relationships with Sydney’s large energy users, to trigger changes in power use when peaks were forecasted,” TransGrid Managing Director Peter McIntyre said.
TransGrid has a stated aim of leading the way for Australian transmission companies in demand response as part of its wider asset investment strategy.
“TransGrid is a proven leader in innovative demand-side management, integrating demand response into its network planning and development of
WWW.UTILITYMAGAZINE.COM.AU UTILITY • MAY 2014 13
The future is now
ENERGY NETWORKS
THE TRANSGRID TEAM DISCUSS THE IDEMAND PROJECT AT EASTERN CREEK.
The future is now
major projects,” said Christian Weeks, EnerNOC Australia and New Zealand Managing Director.
In 2014 TransGrid announced its iDemand project. iDemand is an innovative, hybrid energy-system project aimed at investigating better management of peak demand through a combination of on-site energy generation, storage and efficient energy use.
TransGrid is trialling iDemand on its own headquarters in western Sydney. The primary retrofit involves the installation of almost 100 kW of solar panel capacity on top of the site carpark to harness solar energy for immediate onsite use. Lithium polymer batteries with a 400 kWh capacity will store energy during off-peak periods for use at times of higher demand. The site will also be fitted with energy efficient LED lighting.
Construction of the iDemand project is expected to be completed in September 2014 and is expected to result in a 50 per cent reduction in total onsite peak demand during summer periods. This will be equivalent to removing almost 40 households from the grid on a typical summer weekday.
The system will also include an integrated IT interface which will provide opportunities for research collaboration with universities, and enable real-time data displays of daily demand reduction and the outputs of the solar panels and batteries.
The data and outcomes of iDemand will be available on TransGrid’s website for public viewing.
In November and December 2013, TransGrid asked consumers what they thought of the company investing in demand management innovation. Responses were generally very supportive, because reducing peak demand on the network in turn reduces the investment that TransGrid needs to make, which in turn reduces the network charges that influence customers’ bills.
However, it was found that many consumers still do not understand industry or investment drivers such as peak demand, and are looking for more information about how to reduce their electricity use.
According to TransGrid, the greatest challenges in any demand response
program are those involved in tailoring the solution to fit the key requirements for its success.
The demand response must be:
• In the right place. The response needs to occur in the area of network constraint; if support is to be provided at a sub-optimal location its magnitude must be greater.
• At the right time. The response must occur at the time the network is under the most pressure to be effective.
• Of a relatively large magnitude (megawatts).
It is hoped that the results from the iDemand trial will be instrumental in energy research, and the program will provide potential for market development, offering businesses the opportunity to retrofit their work sites with similar systems.
TransGrid considers that demand management and demand response will continue to be a vital part of transmission network planning in NSW. Demand response can be a cost-effective option for deferring or avoiding investment to augment the network, and also a useful tool for managing exposure to the volatility of energy demand.
Due to changing patterns of demand and existing capacity of TransGrid’s
network, there are no immediate constraints that require a demand response solution. However, recent variations have been more extreme than expected, so in order for sufficient demand response to be available when it’s needed, TransGrid is continuing to invest time and effort in developing the market to better enable successful implementation of demand response solutions.
TransGrid envisages that a deep demand response market will become a vital aspect of a flexible and robust future grid.
The company intends to continue to undertake to minimise the impact of its network where it can otherwise meet its transmission service obligations, including through the use of non-network alternatives such as those in the iDemand retrofits.
In the past TransGrid has also invested in research and projects to better understand consumer attitudes and behaviours regarding electricity use, and how these can be leveraged to optimise investment decisions. TransGrid would like to continue this work and is therefore currently preparing an application to the Australian Energy Regulator for a ‘demand management innovation allowance’ into the next regulatory period.

UTILITY • MAY 2014 WWW.UTILITYMAGAZINE.COM.AU 14
ENERGY NETWORKS
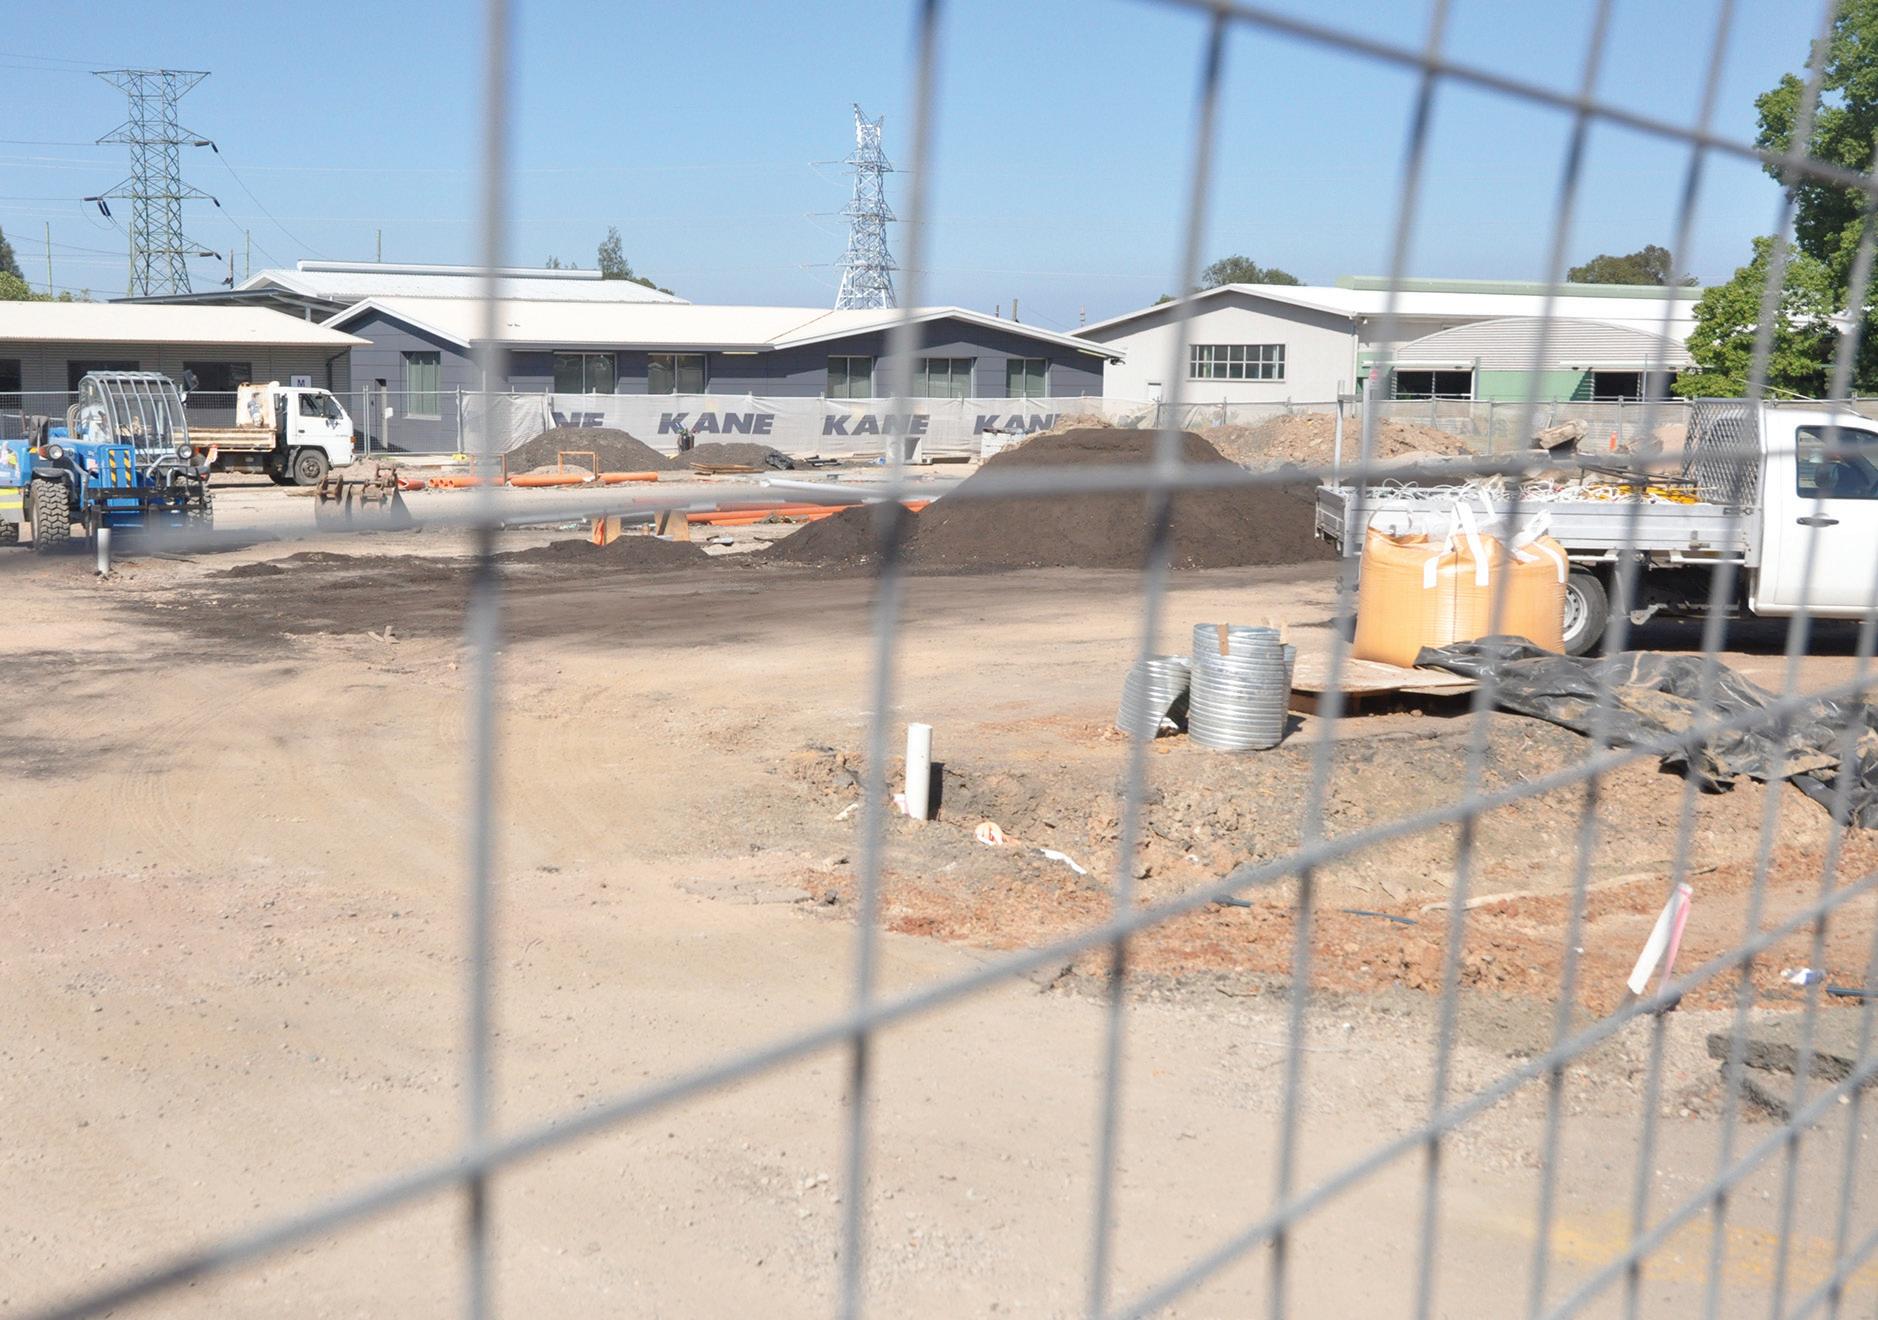
WORK HAS BEGUN ON THE CAR PARK SITE AT EASTERN CREEK WHICH WILL FORM PART OF THE IDEMAND PROJECT.
ELECTRICITY NETWORKS –PRICING POLICIES IN NEED OF REVIEW
Recent changes in electricity demand and usage patterns are becoming a serious issue for the electricity network businesses. How do they fairly charge the customers with PV who are connected to their network for using grid power available when the sun doesn’t shine?
Electricity powers all developed economies. It is critical for homes and workplaces and its availability underpins countless aspects of modern society to such an extent that many risk taking it for granted.
In the future it may not be necessary for everyone to be connected to the electricity grid, as more investment, particularly at a residential level, is directed into solar PV.
It’s all about equity really. At a residential level, utilities are now increasing fixed charges in order to compensate for a lack of revenue from customers who have solar PV but still rely on the grid for power when it isn’t generating sufficient power to meet their needs.
However, higher fixed costs and higher usage charges actually penalise those who cannot afford to install solar PV. A similar situation exists for those who cannot afford air conditioning in their homes. It’s difficult to consider this as cost reflective pricing.
The same disparity in relation to cost reflective pricing is also true for large electricity users. There are many commercial and industrial customers that require the same amount of power continuously 24/7. Meanwhile, other large electricity consumers may use considerably more electricity and electricity network capacity during summer or winter, or for specific periods only.
Since one of the main drivers for increasing electricity network CAPEX is the requirement to build more capacity

to cope with peak demand, network businesses would be expected to recover a large portion of their revenue from capacity-based charges.
The majority of electricity network tariffs for large customers are based on their monthly maximum demand. This has led to a significant cross-subsidy from large consumers with a relatively constant electricity demand to those with variable or seasonal demand peaks.
Both issues outlined above could be easily overcome if electricity utilities adopted capacity-based pricing similar to gas transmission pipeline pricing where users pay for capacity on an annual basis, based on their maximum daily quantity.
If customers want to have a certain amount of electricity network capacity reserved for their needs, for example on the hottest day of the year, then they should pay an annual demand charge or capacity charge, based on their demand for network capacity.
If customers can accommodate interruptions to their power supply during network demand peaks, then they could opt to take non-firm capacity and be charged accordingly.
There is probably also a midway position where they could take some firm and some non-firm (interruptible) capacity.
This would ensure that electricity networks have a higher level of utilisation, which should reduce their requirement for ever-increasing investment in capacity infrastructure and would help to
eliminate the cross-subsidies that have been mentioned above.
Not possible you may think? Well yes it is; as the rollout of smart meters approaches 100 per cent it should be possible for network tariffs to become more cost reflective.
Finally, if you think we have seen the end to huge increases in electricity price increases then think again!
As energy-intensive industries shut down and move offshore, utilities will be left with stranded assets for which they will still be allowed to recover costs. That means ever-increasing electricity network charges for those electricity users remaining on the grid.
In the not-too-distant future, battery technology will have improved to such a level that some electricity users with solar PV could completely remove themselves off the grid. Others will use batteries to store off-peak power and smooth out their maximum demand. Electric vehicles could also be charged up overnight instead of during the day to reduce demand.
In this new era, electricity utilities will have to reform their tariffs and provide the correct pricing signals to all classes of electricity users.
It is imperative that electricity utilities confront this situation now and develop cost-reflective capacity based tariffs for all classes of consumers. This will ensure that both utilities and electricity users can make future investments correctly, rather than based on distorted price signals.


UTILITY • MAY 2014 WWW.UTILITYMAGAZINE.COM.AU 16
By Peter Dobney, General Manager Resources and Energy, Orora Limited (Formerly Amcor Limited)
SECTION OPINION
BOOST YOUR PRODUCTIVITY AND PROFIT WITH THE LEADER IN TRUCK-MOUNTED VACUUM EXCAVATORS
Whether it’s potholing for a fibre installation, supporting a HDD rig, or any other non-destructive digging application, Vermeer has the vacuum excavation equipment you need to get the job done.
Our units are available with spoil tank capacities from 500 to over 11,000 litres and include a range of blower and water pump configurations, with the option of air cutting and jetter combo units. Contact us to arrange an on-site demonstration and see for yourself how Vermeer equipment, backed up by unmatched Australian dealer support and a global network over 6,000 people in 60 nations, can make real impact on your productivity and profit.
Vermeer and the Vermeer logo are trademarks of Vermeer Manufacturing Company in the United States and / or other countries. © 2014 Vermeer Corporation. All Rights Reserved. QLD / NSW / VIC / SA 1800 620 720 WWW.VERMEER.COM.AU WA / NT 1800 195 558 WWW.VERMEERWA.COM.AU
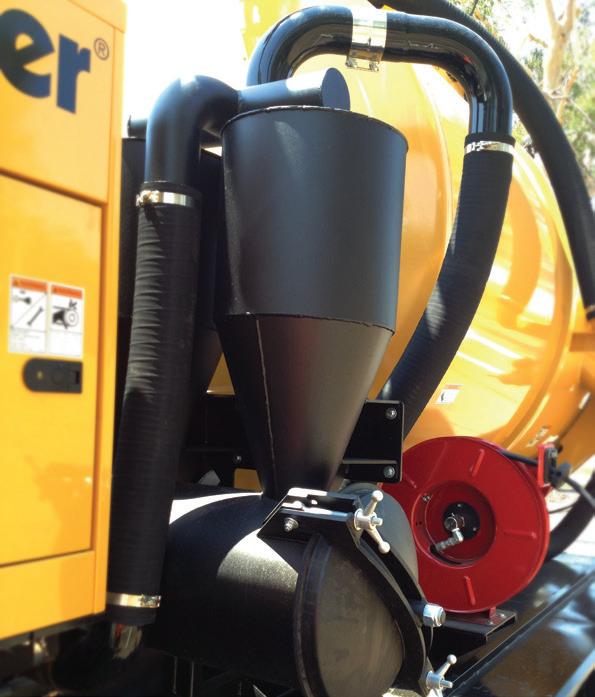
CAM-OVER HYDRAULIC REAR DOOR IN-TANK WASHDOWN & DUAL SHUT-OFFDUAL OIL BATH ROOTS BLOWERTHREE-STAGE CYCLONIC FILTRATION
A WORD FROM THE ENA
For three days in April and May representatives from across the energy supply chain will gather in Melbourne to consider the progress, challenges and opportunities facing the energy networks sector for Energy Networks 2014 – The Future is Now.
The evolution of the energy networks sector means that delegates will come from a broader range of disciplines than ever before. Asset management, regulatory, engineering, information technology, innovation and strategic managers from within network business; senior executives and decision makers; new service providers who are at the forefront of smart-grid technology and services; as well as the more traditional, technical expertise that supports the vital assets of the Australian grid will take part in a conversation that is vital to an energy network that underpins the delivery of safe and reliable energy to almost every household and business in Australia.
Over 145 companies and organisations will be represented at the conference, with participants from across the globe gathering to share in a program that features a comprehensive line-up of national and international keynote speakers and panellists across the plenary sessions of the conference, and presentations that address the four conference themes: Engagement; Innovation; Assets and Gas.
It is not just the Australian energy grid that is experiencing seismic shifts
in the energy generation mix, technology, energy use and in consumer preferences. The global conversation about the future of the energy system has been taken to a new level in recent months, with groundbreaking research analysing potential energy futures based on trends in technology, markets and customer participation.
For the first time, robust and empirical analysis is emerging which helps to inform significant commercial, policy and regulatory choices facing stakeholders.
The UK’s Energy Research Centre has examined ‘Scenarios for the Development of Smart Grids in the UK’, the USA’s Rocky Mountain Institute examines the Economics of Grid Defection, and Australia’s CSIRO Future Grid Forum Report analyses Australia’s electricity pathways to 2050.
Energy Networks 2014 – The Future is Now will demonstrate that the modern energy network is more than just ‘poles and wires’. Network businesses are evolving to meet a dynamic environment, subject to the significant shifts in regulation, technology and consumer expectation.
There will be new approaches to service delivery, pricing and technology – which will be underpinned by a commitment to customer engagement. Far from being obstructionist – energy network businesses have an important role to play as facilitators of the changes happening in the system

As new technology and a wider range of energy-supply choices become available to consumers, the grid continues to play a vital enabling role. Even with on-site generation and the deployment of frontier storage technology the grid will still be required for back-up supply and other services.
Looking to the near future there are significant benefits to be unlocked for customers in reforming network tariff structures, promoting demand side participation and reflecting consumer expectation and choice in investment decisions.
As this takes place the core business of energy networks, to deliver safe and reliable energy, does not change. The shifts within the energy network sector will be complemented by the existing expertise in managing the grid.
This year’s conference continues the Energy Networks Association’s longstanding commitment to sharing best practice and innovation in the sector. With unrivalled access to the leaders and experts in the sector, the conference and exhibition will be the premier event for the energy networks sector to be held in Australia in 2014.
John Bradley Chief Executive OfficerEnergy Networks Association

UTILITY • MAY 2014 WWW.UTILITYMAGAZINE.COM.AU 18
EVENTS
ROLLING OUT A SMARTER NETWORK
Of all new demand management technologies, smart meters are a somewhat surprising candidate for one of the most talked about and controversial. Nevertheless, in Victoria, the smart meter rollout is now more than 98 per cent complete, with more than 2.6 million metering units installed, and consumers are beginning to have a greater understanding of the benefits they offer.
Victoria led the way on smart meters, with all five electricity network distributors rolling them out in accordance with state government legislation. Utilities around Australia have since begun their own rollouts, or are considering or trialling the new meters along with other network technologies.
Smart meters are also in use in much of NSW, and have been installed on the ACT power network since 2007.
Learning from the Victorian rollout, electricity providers have primarily decided not to complete a mandated rollout with compulsory time-of-use pricing, but to offer voluntary flexible pricing options.
THE VICTORIAN ROLLOUT
The Victorian smart meter program is a major infrastructure upgrade intended to replace old meters with newer technology with a wider range of capabilities. After meeting initial resistance, the program was reviewed in 2011 to rein in costs and a campaign was launched to make customers more aware of what smart meters were, how they worked and what benefits they offer.
The Victorian Government also launched the My Power Planner tool to make it easier for Victorians to make informed choices about power deals and the possible flexible pricing options available with smart meters.

A key benefit of smart meters is the extra information they give consumers about their power use. Through tools like web portals, in-home displays and smartphone apps, many Victorians are now able to access the half hourly readings of their smart meter, giving them a detailed and up-to-date picture of their power use.
This information can be used by customers to make significant savings by informing decisions and changing behaviour.
Smart meters have also enabled the introduction of new flexible pricing
options, giving Victorians more choice when they are looking for power plans that can save them money.
Flexible pricing is now available as a voluntary option, with those who choose it being charged different rates for their power at peak, shoulder and off-peak times.
Victoria has one of the most competitive electricity markets in the world, which means there are significant savings on offer for consumers who are willing to shop around.
My Power Planner, which has been endorsed by consumer group
UTILITY • MAY 2014 WWW.UTILITYMAGAZINE.COM.AU 20
SMART METERS i
Choice, allows people to create a personal profile of their power use and then use this to compare all the available offers out there in Victoria’s highly competitive market.
Customers can either upload data from their smart meter into the tool or answer a series of questions to create a personal profile of their power use.
There are more than 3,000 plans now loaded into My Power Planner, making it simpler and easier for Victorians to find the deals that will save them the most money.
One of the problems with the early stages of the smart meter program was that the benefits of the new meters had not been explained to the public.
The current Government has moved to address this with the launch of a significant public information campaign explaining how the electricity market works and how smart meters and new options like flexible pricing can help people save money.
This campaign has included the establishment of the Energy Information Fund, designed to make sure all Victorians get the facts they need to make good decisions about electricity.
Smart meters also have a role to play in dealing with one of the key challenges in the Victorian electricity space – peak demand.
Spikes in electricity demand at peak times in Victoria (such as on hot summer days when air conditioner use is greatest) can put pressure on the grid and require investment in expensive generation and network infrastructure that is only necessary for a very small part of the year.
With the voluntary introduction of flexible pricing, enabled by smart meters, we are seeing for the first time price signals to help shift demand outside of peak times.
Shifting demand out of the peak period will allow the deferral of expensive new investments in generation and network infrastructure which will help save money for both utilities and customers.
What do smart meters do?
The ENA describes smart meters as an enabling technology to support timely information to customers on their energy use and enhanced ability for networks and retailers to manage their energy market roles and responsibilities.
Smart meters measure and record (at 30 minute intervals) how much electricity a household or business is using. They can enable customers to make informed choices about how much energy they use by providing accurate real-time information about electricity consumption. They enable customers to have greater control over their energy use and cost.
Smart meters can also reduce some of the costs for energy companies which feeds into customer bills. They can communicate meter readings directly to electricity distributors or retailers, eliminating the need for someone to come out and read the meter – whether that is for each quarterly bill, to change electricity retailer or to reconnect power when moving house - and this provides better service to the customer.
Smart meters can also notify the electricity distributor where power is out in real-time, which can speed up power reconnection because the source of the problem can be pinpointed instantly. Smart meters also support consumer generation (eg by solar PV installations).

WWW.UTILITYMAGAZINE.COM.AU UTILITY • MAY 2014 21
SMART METERS i
HOW TO SELL SMART METERS TO CONSUMERS
By Cameron O’Reilly, Chief Executive of the Energy Retailers Association of Australia (ERAA)
Electricity meters are not usually a topic to feature prominently in mainstream political debate.
Yet in the last Victorian State Election they became a hot issue and were said to have contributed to the narrow defeat of the then Brumby Labor Government.
Whether that was true or not, the fact that something as obscure as smart meters could have been so controversial underlined a failure of policy and communication.
The hardware of metering should have remained outside the home, literally and figuratively. A smart meter should be seen as nothing other than a platform to offer enhanced services and information for the benefit of consumers. It’s those services and benefits, not the meters themselves, that should be the topic of conversation.
For utilities, smart meters are a logical step in bringing the electricity industry into the 21st century. The immediacy and accuracy of information they provide is what should be expected in the digital age, and the phasing out of practices such as manual meter reading and all the associated problems of access and estimated bills, is long overdue.
SO WHERE DID IT ALL GO WRONG IN VICTORIA?
First was the message of compulsion through a mandated, distributor led rollout. When people are told that something has to change in their home, they want to know why. We generally
don’t like being told what to do by our Governments. That said, Australia has one of the best records of achieving behavioural change through public information campaigns.
The digital switch-over in Australian broadcasting, which saw the phasing out of analogue televisions and the installation of set-top boxes, went smoothly because consumers understood there was a benefit to them from the process.
Importantly, there was also no upfront cost to the consumer by introducing digital television, despite the fact that some households did have to replace ageing television sets out of their own pocket.
During the smart meter rollout in Victoria, households did not see, nor understand, the benefits of the rollout, but were asked to pay for the meters through network charges before they became operational.
The itemising of smart meter costs on one retailer’s bills, and the resulting report in a tabloid newspaper, added even more fuel to the fire of consumer resistance. Misinformation about the safety of the meters was then able to permeate a debate that had grabbed the media’s attention. Once you’ve reached

that stage, the media constantly look for new angles to attack the bogeyman of smart meters.
The second major mistake was the argument used to sell the benefits of smart meters, promoting time-of-use pricing and its potential to reduce peak demand. The obvious point of reply was that time of use would benefit some users but not all.
For some groups, time of use was perceived to be punitive. Therefore, the smart meters became seen as an up-front cost that could enable ongoing pricing detrimental to the interests of some categories of consumers. Consumer advocates became convinced it was their constituencies that would become the victims of smart meters, and a new social dimension of winners and losers complicated the debate.
The current State Government of Victoria has handled this argument quite well by ensuring a regime of voluntary adoption of renamed flexible pricing. It has had to do this from a defensive position and in an environment where the public perception of smart meters has been irrevocably damaged.
That is a shame, because there are clear benefits to the consumers when smart meters go live. I’ve already
UTILITY • MAY 2014 WWW.UTILITYMAGAZINE.COM.AU 22
SMART METERS i
The smart meter platform is sure to see retailers offering Victorian consumers a broader array of products to adjust behaviour and manage bills.
alluded to the phasing out of estimated bills, to which one would add the benefit of more flexible and regular billing cycles, rapid connection and disconnection for new and moving customers, information portals and in-home displays to track energy use and the ability to manage two-way energy flows in the increasing number of homes with distributed generation.
In the environment of one of the most competitive retail markets in the world, the smart meter platform is sure to see retailers offering Victorian consumers a broader array of products to adjust behaviour and manage bills. In a market with an annualised switching rate of 25 per cent, retailers will have a strong incentive to try and innovate and build a stronger, more interactive relationship with the customer as part of their retention strategies.
Not surprisingly, all the other State Governments are wary of smart meters as a result of the Victorian experience. The Standing Council on Energy and Resources (SCER), has clearly decided that a mandated rollout by distributors will not be the chosen path in the future. What will be the basis of an alternative market led approach is a question challenging policy-makers as we speak.
We are all wise in hindsight, but if Australians had simply looked across the Tasman, they might have seen a highly competitive retail market in which smart meters were being rolled out to consumers in a seamless fashion. More than half of New Zealand householders now have smart meters, but few would know it as they’ve been implemented by retailers as part of bundled offers to customers. To New Zealand consumers, it’s the retail offers that matter, not the hardware which enables them.
New Zealand started with the advantage, unlike Australia, of metering
contestability. But their industry also recognised that uptake would not occur if it was perceived to be a new cost to consumers. As with Australia, metering charges have always existed, yet Victoria made consumers conscious of them.
In New Zealand, it was the retailers themselves that had to establish the business case for the meters and then sell them as part of a bundled product to consumers. Once they established that case in their own minds, and in some cases built their own business capacity, the rollout gathered significant momentum – putting lie to the notion that a market-led rollout will be painfully slow. Indeed having built this capacity in New Zealand, some of the metering players are eyeing a market led rollout in Australia with a sense of opportunity.
In considering a market-led rollout in Australia, the old adage that you wouldn’t start from here is probably apt. Victoria has made the customer sales task more challenging and we still have to pass a number of regulatory changes to enable the necessary contestability in metering and the related service provision. The unbundling of metering charges from network charges is a top priority in this regard, as well as adopting light-handed regulation in a metering market heavily influenced by technological change.
As New Zealand has shown, none of these industry related changes need to matter or be visible to the consumer. What is important is that the consumers can see benefits through bundled, competitively priced offers that attract them to taking up a smart meter from their retailer. Once this happens all retailers are likely to feel pressure to follow suit. Those that don’t run the risk of being left behind.
Many issues will be brought forward to argue against this consumer driven
approach to smart meters and the Energy Retailers Association of Australia (ERAA) has anticipated these in a series of papers that appear on its website www.eraa.com.au. Issues such as privacy, ownership of the data, third party providers and meter churn are all capable of being addressed. There is no doubt that the market that evolves will be more complicated and potentially slower to develop than a mandated one. The difference will come in the consumer acceptance.
When all is said and done, consumer acceptance and support is critical to the success of any smart meter rollout. Technology that is embraced and supported is more likely to see behavioural change. That behavioural change is critical to the business case for smart meters and it is the consumer-facing end of the energy value chain, the retailers, who should be entrusted with it. In doing so, we should be working hand in hand with Governments whose information is, we have to admit, more trusted by the public.
What we do know from a range of market surveys is that consumers want more information and control. When it comes to retail contestability, market research has also shown that there is a strong attraction to the idea of choice. Smart meters can enhance that choice.
The electricity industry will have to get in to its head that while it has to create its own business case for smart meters, that business case will have to be predicated on consumers being prepared to buy the product. Victoria has ensured there is no more telling consumers what is good for them, there is only the path of persuasion. It’s a whole new ball game, but New Zealand has shown it can be done.
WWW.UTILITYMAGAZINE.COM.AU UTILITY • MAY 2014 23
SMART METERS i
THE EMERGING BATTLE FOR THE CUSTOMER RELATIONSHIP
By Kristian Handberg, Principal Consultant, Percepscion
As change gathers pace in the Australian electricity market, the entry of new players from telecommunications, entertainment and other service industries appears increasingly likely. According to utilities and home service providers at the recent Smart Energy Summit in Austin, Texas the key battleground will be for control of the customer relationship.
In its fifth outing, Smart Energy Summit: Engaging the Consumer, organised by Parks Associates, examined the expanding market for energy solutions and home controls, along with their impact on utilities, service providers, retailers, manufacturers, and consumers. Around 250 industry representatives gathered in the booming Texan capital to evaluate new partnerships, strategies for consumer engagement, and deployment plans for energy and management solutions in the ‘Connected Home’.
Indicative of the increasing importance of the topic, the event was around one third bigger than previous years. The breakdown of attendees highlighted the emerging competition from outside the sector, with an
equal share of vendors, home service providers and utilities/energy providers. My company Percepscion, a Melbourne-based home energy technology start-up, was invited to talk about our 2012 electric vehicle charging demand management project, delivered with United Energy.
UTILITY CHALLENGE FROM CUSTOMER CONVERGENCE
Presentations and discussions throughout the event highlighted the convergence of energy and home service provider customer relationships. Utilities, striving to adapt to more customer-centric business models, face a growing challenge from battle-hardened home service providers, who can leverage a broader and potentially more
compelling product portfolio beyond merely energy.
Utility heavyweights such as Duke Energy, Southern California Edison (SCE), San Diego Gas & Electric (SDG&E), Austin Energy, Reliant/NRG and TXU described their efforts to engage customers, who for the most part were described as apathetic. Dennis Garman, Duke’s Head of Energy Management and Information, outlined the company’s forthright efforts to engage customers through regular home energy reports. In contrast, Scott Burns, Reliant’s Director of Innovation, described their more passive approach of providing online tools for consumers who seek them out.
From the home services side, providers such as Lowe’s, Comcast and
UTILITY • MAY 2014 WWW.UTILITYMAGAZINE.COM.AU
24 SMART METERS i

Alarm.com spoke of their success in engaging consumers with platform offerings that include energy management in the form of lighting and thermostat controls. Tim Lott from Vivint described how his company has built out from home security services to now offer solar power system design, finance, installation and servicing.
Research presented by Parks Associates’ analysts helped explain the market development by pinpointing ‘lifestyle’ as the most compelling aspect of the consumer value proposition. Homeowners are seeking energy management solutions that provide greater convenience and improved amenity ahead of or along
with cost savings. In the context of the ‘connected home’, a typical quote that might sum up this sentiment may be, “My home makes my life easier and more comfortable, and even saves me money”.
FUTURE UTILITY STRATEGY – PARTNER OR COMPETE?
The event underscored how the changing marketplace represents a world of risk and opportunity for utilities. Network services will continue to provide the business model foundation, on which utilities will then need to decide on their approach to the customer relationship.
The increased sophistication and growth in Demand Response program offerings from the utility industry was well represented at the event. Austin Energy’s Debbie Kimberly described their connected thermostat journey, which is a key part of efforts to reduce peak load by over one third by 2020. Anthony Hawkins, a group project manager for Landis+Gyr, reported on CPS Energy’s Virtual Power Plant initiative in nearby San Antonio which will support delivery of 50 MW or more of peak demand reduction into the ERCOT market in 2014.
Home service providers demonstrated their breadth and depth in terms of
WWW.UTILITYMAGAZINE.COM.AU UTILITY • MAY 2014
25 SMART METERS i
TIME WARNER CABLE’S INTELLIGENTHOME USER INTERFACES, WHICH INCLUDE ENERGY MANAGEMENT FUNCTIONS SUCH AS HEATING/COOLING AND LIGHTING CONTROLS (SOURCE: TIME WARNER CABLE).
The emerging battle for the customer relationship

CPS ENERGY’S HOME ENERGY MANAGER APP, THE CUSTOMER FACE OF THE COMPANY’S VIRTUAL POWER PLANTS IN SAN ANTONIO, TEXAS (SOURCE: CPS ENERGY). (
Willingness to Buy Home Monitoring Products: Energy vs. Non-Energy (Q4/12)
"Q7435. How likely are you to purchase the following if the product can be monitored and managed from inside your home or while you were away using a computer, mobile phone, or tablet?" (Among BB HHs, N=2500, ±1.96%)


RESULTS FROM A SURVEY OF US BROADBAND-CONNECTED HOUSEHOLDS, HIGHLIGHTING THE OVERLAP BETWEEN ENERGY AND NON-ENERGY RELATED PRODUCTS FOR THE CONNECTED HOME (SOURCE: PARKS ASSOCIATES RESEARCH 2014).
product offerings, national coverage and customer support. Kevin Meagher from Lowe’s, a home products retailer with 15 million shoppers through their stores each week, described their approach to making homes safer, more efficient and easier to manage. Joe Jankosky from Time Warner Cable, outlined the services delivered by their integrated home management platform including entertainment, home automation, health and wellness, energy management and home security, with car integration, garden and pet management, and presence applications in the pipeline.
Discussions arising from these presentations suggested that a potential path forwards may be utility-home service provider partnerships, where the distribution of responsibilities will reflect the natural alignment and strengths of each entity – home service providers will engage the
UTILITY • MAY 2014 WWW.UTILITYMAGAZINE.COM.AU 26
i
SMART METERS
Energy & non-energy products, 37% No products, 35% Non-energy products only, 17% Energy products only, 1%
consumer through brand recognition and compelling product offerings, while utilities will deliver Demand Response programs that leverage these products and enhance value to the consumer.
While this model had potential appeal to smaller utilities or those with a lack of brand recognition, the tensions arising around ownership of the customer relationship were felt to be a key obstacle, particularly for large vertically-integrated utilities.
The emerging battle for the customer relationship
Utilities, striving to adapt to more customer-centric business models, face a growing challenge from battle-hardened home service providers...
WHAT DOES THIS MEAN FOR AUSTRALIA?
Australia lags behind the US on utility deployment of residential Demand Response and in the availability and adoption of Connected Home products and services. However, with increased demand-side participation in the electricity market targeted by regulators and connectivity in the home growing daily, competitive pressures look set to increase. As utilities ponder their transition to more customer-centric service provider models in response to increased solar uptake and affordable
energy storage, the insights gained from the Smart Energy Summit may serve as a crystal ball into the future for Australian utilities.
Kristian Handberg is a Principal Consultant with Melbourne-based home energy technology start-up Percepscion. Percepscion designed and delivered Origin’s home energy monitor, as well as an electric vehicle charging demand management project in partnership with United Energy through their parent organisation DiUS Computing.


WWW.UTILITYMAGAZINE.COM.AU UTILITY • MAY 2014 27
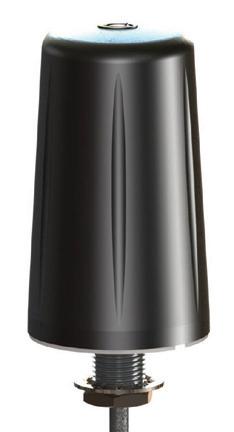
au.sales@panorama-antennas.com Level 1/72 The Terrace, Ocean Grove, Victoria, 3226 1300 859 833 www.panorama-antennas.com/ Technical Drawing • Rugged low profile design • Excellent bandwidth The Panorama LPB low profile antenna range has been designed to perform even in extreme environments. At only 82mm (3.22”) high and protected by a robust high impact radome the antenna is almost impervious to daily wear, tear and impact. The LPB offers excellent performance across a wide bandwith. Mounted on a 400 x 400mm groundplane the LPB covers LTE frequencies across 700 and 800MHz as well as all global cellular frequencies from 698-960 MHz and 1710-2700MHz making it an extremely versatile product. Supplied with a convenient adhesive pad and either a short pigtail for connection to a cable extension or an integrated 5m low loss cable run the antenna is cost effective to install and adaptable to any install environment. M2M Low Profile Antenna LPB Range 11/02/2013 v2 (Nominal measures) Wideband Multiband Low Profile M-LPW-BC3G-27 698-960 & 1710-2170 & 2500-2700MHz 2dBi Gain Omnidirectional Panel Mount & Adhesive Fixing IP Rated H2 / L16 / D3cm Duelband Low Profile M-LPAB-AP 824-894 & 1850-1990MHz 2dBi Gain Omnidirectional Panel Mount & Adhesive Fixing IP Rated H1 / L13 / D4cm Wideband Multiband Stub M-LPB-7-27 698-960, 1710-2700MHz 3dBi @ 700/800 4dBi @ 900/1800 5dBi @ 1900/2100/2400/2600 Panel Mount & Adhesive Fixing Omnidirectional IP Rated H8 / L4 / D3cm GSM & LTE Metering Antennas Untitled-1 1 1/04/2014 1:06 pm SMART METERS i
In times of climate and economic uncertainty, investing in measures to assure water efficiency is a wise, and in some cases vital, move in order to continue meeting customer demand into the future and to mitigate the effects of events such as drought and natural disasters. But when, and how, should utilities invest in water efficiency measures? The Water Services Association of Australia (WSAA) has completed a report addressing these questions.

UTILITY • MAY 2014 WWW.UTILITYMAGAZINE.COM.AU 28 Water Efficiency in Focus WATER

29 WWW.UTILITYMAGAZINE.COM.AU UTILITY • MAY 2014 Water Efficiency in Focus WATER
WATER EFFICIENCY: A DEFINITION
Water efficiency is ‘any measure that reduces the amount of water used per unit of a given activity, without compromising the achievement of the value expected from that activity.’
Since the 1980s utilities have invested sporadically in water efficiency either on the back of a period of severe water restrictions, in response to regulation or at the request of their customers. This investment usually occurs where the business case has predicted it will be cost effective, the community supports the initiative and robust analysis indicates it will save water.
WHY INVEST IN WATER EFFICIENCY?
A more consistent, diverse and incremental approach to investment in water services minimises the impact of climate uncertainty and significantly reduces (if not eliminates) the need for severe water restrictions. This approach requires the routine investment in cost effective water efficiency programs even in times of plenty. This limits per capita demand, meets customer expectations, improves productivity in the industry and eliminates waste. With population growth, and both climate and economic uncertainty impacting the industry, water efficiency investment may provide a buffer should unexpected events occur to impact water demand or supply.
Maintaining a baseline investment provides a good platform to launch more aggressive water efficiency programs as water security drops. It also readies the community to accept short term water conservation measures (i.e. those measures that reduce the volume of water used and could impact on the water users’ amenity or level of service) that may become necessary should a sudden and severe drought occur.
Such measures should not come as a surprise to the community as utilities are encouraged to publicly communicate the water demand forecasts annually and provide updates on the water supply situation before summer. Therefore decisions regarding ramping up water efficiency programs or implementing water conservation measures
can be made in times of need.
Management of water use above or below the approved forecast needs to be prioritised and acted upon accordingly. Setting a water efficiency benchmark may be a part of this process. Evaluation and regular reporting of water efficiency programs are encouraged in order to support legitimate long term investment and to improve business confidence in water efficiency.
WATER EFFICIENCY PROGRAMS AND SAVINGS
Urban water utilities have run water efficiency programs for their customers since the 1980s. These were scaled up and new programs were added during the Millennium drought. During this period the water savings made by customers had a marked impact on avoiding critical water shortages.
These measures and the efforts of customers resulted in significant water savings of about 350GL/year across Australia’s major cities during the drought (Table 1). Total per capita consumption in Melbourne, for example, dropped 43 per cent from 423 litres per day (lpd) in the 1990’s to 241lpd in 2009/10 helping to conserve precious dam water for high end uses (Figure 1).
In recent times, it appears that a new norm regarding water use behaviour has emerged, with wide support for low level permanent water efficiency measures and no significant bounceback in demand (as shown in daily water use levels in Sydney in Figure 2). Recent customer surveys by urban water utilities verify this support (eg. in Melbourne this support is at about 70-80 per cent).
The types of programs that are now well established and likely to continue include:
• Effective leak management programs operated by utilities;
• Permanent Water Efficiency Measures (use of trigger nozzles, restricted use of sprinklers, no hosing of driveways and paving areas);
• Smart Approved Watermark (Australia’s water conservation quality mark label for efficient products and services);
• Water Efficiency Labelling Scheme (WELS star rating label for residential tapware, toilets etc.);
• Preparation and implementation of water efficiency management action plans or waterMAPS by large non-residential customers (Western Australia and Victoria);
• Minimum water efficiency standards for rental properties (New South Wales and Queensland);
• BASIX (minimum water efficiency standards for new and renovated homes-NSW).
WATER USAGE
Agricultural water use accounts for around 65 per cent of water consumption across Australia; in comparison customers of urban water utilities use only around 16 per cent of available water. Across Australia’s capital cities household customers use 70 per cent of water supplied, 20 per cent is used
CASE STUDY ONE –HUNTER WATER (NSW)
Hunter Water plans to construct a scheme to provide high quality recycled water to industrial users in the Kooragang Island area. The majority of the water will be used by Orica, a company that supplies fertiliser and explosives for the mining industry. The scheme will divert treated effluent to a new Advanced Water Treatment Plant (AWTP) at Steel River. Water efficiency at Kooragang Island is a critical requirement to minimise the cost of new infrastructure and to avoid the high treatment costs associated with the AWTP. Importantly, a further constraint on the system will be the availability of wastewater. The project will divert treated effluent from the existing effluent pipeline for Shortland Wastewater Treatment Works. If demand from recycled water users increases, then effluent from further afield will be required, this would involve significant new infrastructure and conveyance costs.
UTILITY • MAY 2014 WWW.UTILITYMAGAZINE.COM.AU
30
Water Efficiency in Focus
WATER
in the commercial/industrial sector and 10 per cent is lost. In some regional areas like Gladstone in Queensland the split is almost directly opposite to this due to greater industrial use.
Recent residential water use studies found a high amount of indoor water use in showers (29.5 per cent in South East Queensland (SEQ), 30 per cent in Melbourne and 25 per cent in Perth) and significant household leaks i.e. 6 per cent (South East Queensland and Melbourne) and 4 per cent (Perth). As an example Perth’s household water use is broken down as shown in Figure 3. However, this may not be representative of water use on the east coast as in Melbourne and Sydney less water is used outdoors and more in laundries and showers.
In most cities an analysis of commercial/industrial customers water use shows many are using small amounts of water and far fewer are using large amounts. This is why many non-residential water efficiency programs target individual larger users achieving outstanding results. For instance, the waterMAP program in Melbourne required all non-residential customers that used over 10ML per annum to develop a water management plan (waterMAP). This program resulted in water savings
of 17GL over a four-year period.
DEMAND FOR WATER
There are four main factors that determine changes in demand for water: population growth, climate change,
housing type and density and changing demographics.
Other factors that affect predictions of water demand (otherwise known as demand forecasting) include:
• The performance of water
CASE STUDY TWO – TOLLMAN, A CUSTOMER OF CITY WEST WATER (VIC)
Tollman Pty Ltd is a contract chemical manufacturer that formulates, blends, packages and distributes chemicals for a number of industries, including agriculture, mining, paper, building/construction, cement and recycling throughout Australia.
A Cleaner Production Consultant from City West Water discussed water saving opportunities with Tollman and, after studying other business examples and researching suppliers, Tollman decided to trial a new Cleaning in Place (CIP) system to reduce its use of wash water.
By changing the washing method from a boil out method to a CIP method, Tollman found they could reduce their water use from 16-24,000 litres per wash to 700 litres per wash. The system includes a portable orbital high pressure cleaning nozzle, which is situated inside the cleaning tanks. The use of these nozzles eliminates the need to fill the tanks fully with water and boil them out with steam.
The change in process has resulted in water savings of 3.7 million litres per year, which is approximately equivalent to one third of the site’s total water use. The discharge of trade waste has also been reduced by the same volume.
The environmental benefits of this change were significant, including reduced gas consumption of one terajoule per year, reduced total dissolved solids or salt discharge of 1.5 tonnes per year, reduced greenhouse gas emissions of 50 tonnes of CO2e per year and reduced downtime by 624 hours per year.
WWW.UTILITYMAGAZINE.COM.AU UTILITY • MAY 2014
Focus 31 WATER Dec ‘02 Jun ‘03 Dec ‘03 Jun ‘04 Dec ‘04 Jun ‘05 Dec ‘05 Jun ‘06 Dec ‘06 Jun ‘07 Dec ‘07 Jun ‘08 Dec ‘08 Jun ‘09 Dec ‘09 Jun ‘10 Dec ‘10 100 200 Jun ‘11 300 400 500 600 700 800 900 1,000 1,100 1,200 0 5% 10% 15% 20% 25% 30% 35% 40% 45% 50% 55% 65% 0% 60% % F u l l S y s t e m S t or a g e ( G L ) T he p ercent age show n are b ase d on a s torage c ap acit y of 1810 5G L including Tarago R eser voir E s timate d s torage vo lum e without water conser vation R e corde d s torage vo lum e
Water Efficiency in
FIGURE 1: MELBOURNE’S STORAGE VOLUME 2002 – 2011 (SHOWING IMPACT OF WATER CONSERVATION)
efficiency programs such as the installation of water efficient appliances and behaviour change programs designed to reduce water use, communications programs, permanent water efficiency measures (PWEMs)
• The level of bounce back in demand after a period of water restrictions
• Affluence and lifestyle
• Higher prices for water
• Economic growth.
THE ENERGY – WATER NEXUS
Factors driving energy demand and their relationship to water efficiency
There are currently two main issues affecting energy network businesses; these are costly augmentations of the network to meet short lived spikes in demand, and rising unit costs of supply as higher costs are recovered from flat or falling volumes. The three main drivers of peak demand in the residential sector are air conditioning, water heating, and pool pumps and filters.
Hot water use and water efficiency
Studies by WSAA and CSIRO on the energy-water nexus in the urban water industry have identified how dominant end-use energy is in the overall energy profile through the urban water cycle (Kenway et al. 2008). In fact nationally, a 15 per cent reduction in the use of residential hot water would completely
offset the total energy used by the utilities providing water to those households in 2006/07. For householders, simply shifting to a WELS 3-star rated showerhead can decrease energy consumption for hot water by approximately 50 per cent (where those households have considerably greater-than-average water use). Showerhead retrofit and
exchange programs across Sydney and Melbourne households have saved a combined total of 8.5GL/yr.
Water and energy efficiency in businesses
Many WSAA members have reported that non-residential water efficiency programs have had the added benefit of reducing energy use for their
CASE STUDY THREETHE NATIONAL BUSINESS BENCHMARK WATER EFFICIENCY PROJECT
The National Business Benchmark Water Efficiency project aims to encourage businesses to develop, understand, and compare their water use benchmarks.
The project is a collaborative effort between WSAA members, the Department of Sustainability and Environment (Victoria) and Smart Water Fund (Victoria).
One of the key outputs from the project will be an easy to use online tool to house data within a water efficiency benchmarking framework. Benchmarking helps a business understand their performance over time and also facilitates comparison between businesses of a similar type. Businesses that know and understand their benchmarks can gain a competitive edge over others in their field. Benchmarking should be a continuous improvement process. A business that knows their water use benchmark can move from average to being an industry leader.
For example Longwarry Foods, located on the outskirts of Melbourne, effectively increased their production, decreased the amount of water they used per litre of milk produced and increased their profits. This was achieved by ensuring a thorough understanding of their own water and energy benchmarks, the benchmark of their industry sector and implementing a range of measures to maximise water efficiency at their site. Over a three year period, Longwarry Foods achieved a 423 % increase in turnover but only a 38% increase in water use. Managing Director Rakesh Aggarwal noted “Our focus on targeting water efficiencies helped increased our overall business growth.”
UTILITY • MAY 2014 WWW.UTILITYMAGAZINE.COM.AU 32
WATER
2010 2011 W a t e r W i s e r u l e s Year en din g Jun e 1999 W a t e r s u p p l e d p e r p e r so n p e r d a y ( l i t r e s / p e r so n / d a y ) 2000 2001 2002 2003 2004 2005 2006 2007 2008 2009 320 340 360 380 400 420 440 460 300 Weath er co r re c te d (365 - day m ov in g aver ag e) M a n d i t o r y r e s t r i c t i o n s P r er e s t r i c t i o n s V o l u n t a r y r e s t r i c t i o n s
Water Efficiency in Focus
FIGURE 2: DAILY WATER USE IN GREATER SYDNEY 1999 - 2011
City/Town/ Region Annual water savings (ML)
Sydney 120,000
Perth 90,000
Best performing programs
Melbourne 60,000
> Permanent Water Wise Rules
> Leak management
> Business water efficiency programs
> Permanent water efficiency measures (2 day/week sprinkler roster)
> Communications and water loss management programs
> Showerhead exchanges
> Watersmart rebate program
> waterMAP program (non-residential customers)
> Target 155 Campaign
Adelaide 55,000
> Permanent Water Wise Rules
> Residential appliance rebate/exchange programs
> Industrial, Commercial and public open space water efficiency programs
Canberra 25,000
> Permanent water conservation measures
> Communications, education and awareness raising programs
> Toilet and showerhead retrofit programs
> Large non residential customers demand management program
Hunter region (NSW) 1058
Ballarat 1000
> Showerheads and tap retrofits
> Technical water efficiency programs
customers. This is why engagement with non-residential customers has become a focus not just on water but on energy given that for business customers the bottom line is often dominated more by energy costs than water. For example:
• An upgrade of cooling towers at a glass manufacturing plant is saving 22 million litres of water and 440,000 kilowatt hours of electricity each year at a one-off cost of $443,000 (the dollar savings for energy equate to $35,000/year, and chemical savings are $30,000/year)
• City West Water’s Steam System Efficiency Program involves providing free steam system audits and training to manufacturing, industrial and hospital
customers to improve water and energy efficiency in these systems. Across the program they expect to save 239ML/year of water, 187,000GJ/year of energy and 10,400 tonnes of CO2/year
• Replacing eleven showerheads at an aquatic centre saved $2400/yr in energy costs and using a pool blanket saved $180,000 in energy costs (before factoring in the cost of the pool blanket at $140,000)
• Replacing 540 guest showerheads at a hotel with water efficient luxurious showerheads saved 12.6 million litres/year and 3,600 gigajoules of gas per year, with great feedback from customers on the performance of the showers.
Water Efficiency in Focus
THE ROLE OF REGULATION
Temporary water restrictions
Temporary water restrictions do have an impact on reducing water use (Figure 2) and can contribute to a step change in water use. They come at a cost through the loss of gardens and public open space affecting amenity and lifestyle, and economically impacting on the garden industry. For these reasons, WSAA believes temporary water restrictions are not a water efficiency measure; they are reserved for a sudden and unpredictable emergency.
The willingness of customers to save water during the drought has led some utilities to work with government to regulate for permanent low level ‘common sense’ water efficiency measures; savings from these are significant (see Table 1).
A recent study by the Australian National University has found that ‘households now prefer low level water efficiency measures to a situation with no restrictions but are more opposed to higher level restrictions than they were in 2003 and are willing to pay more to avoid them (McNair & Ward 2012).
Other mandatory water efficiency measures
These include:
• Water Efficiency Labelling and Standards Scheme (WELS);
• Minimum water efficiency standards for new and renovated homes e.g. BASIX (NSW);
• The preparation and implementation of water efficiency management plans (WEMPs) or WaterMAPS by large nonresidential customers (e.g. WA and Victoria); and
• Minimum water efficiency standards for rental properties (NSW and Queensland).
PRICING
The urban water industry has a sound record of using pricing to improve the efficiency of water use. The introduction of user-pays pricing in Perth in 1978 was a seminal point in using water prices to influence demand and to raise the revenue needed to provide high quality and reliable water services to customers. User-pays pricing
WWW.UTILITYMAGAZINE.COM.AU UTILITY • MAY 2014 33
WATER
WATER
Water Efficiency in Focus
Ir r i gati o n 39 %
Sh owe r an d b ath 25%
To il e t 9 %
Washin g ma chin e 7%
Taps 6%
Ev ap o r ati ve air con di ti o n e r 4%
Leak s 4%
H an d w ate r in g 3%
Po o l an d sp a 2%
D ishw ash e r 1%
KEY POINTS:
• The efficient use of water is a key part of building Australia’s water security.
• Using water wisely is a way that many customers can make their personal contribution to the environment, while benefiting financially through water and energy cost savings.
• Reduced water demand also benefits customers as it defers the need for large-scale water supply infrastructure.
• The introduction of temporary water restrictions should only be a response to a sudden and unpredictable emergency and not viewed as a water efficiency measure.
is now almost universal in Australian cities and, more recently, the use of inclining block tariffs has begun to send stronger pricing signals to urban high water consumers. For example SEQ, Melbourne and Adelaide have three inclining blocks.
The most recent study into the elasticity of demand for water found:
• It takes about a year for households to adjust from their
CASE STUDY FOUR – BASIX (NSW)
immediate to long-term position;
• If water usage prices were increased by 10 per cent the total decrease in demand over a year would be 1.1 per cent;
• That once a household upgrades the efficiency of its appliances its long term price elasticity is almost halved;
• The importance of developing individual price elasticity estimates
for different user groups;
• The combination of a forecast increase in the proportion of housing units, new houses with smaller property sizes, and improvements in penetration of and efficiency of water using appliances will reduce the ability of water usage prices to influence residential demand.
BASIX is a planning policy requiring all new houses and residential units to be designed to use up to 40% less drinking water and emit up to 40% fewer greenhouse gas emissions than the average NSW dwelling. Economic analysis conducted in 2009 estimated that to 2050, new BASIX certified dwellings will generate a positive benefit to NSW of between $1.20 and $1.60 for every dollar spent complying with BASIX, most of which accrues directly to individual householders through lower energy and water bills.
The total net benefits (minus compliance and administration costs) of BASIX for NSW to 2050 are estimated to lie within a range of $294 million to $1.1 billion. Forty-six per cent of these benefits are from BASIX certified dwellings already approved for development.
The dollar value energy and water bill savings through BASIX compliance are estimated at between $7,123 and $10,249 for an average four-bedroom Western Sydney household built in 2006, or between $158 and $228 a year to 2050 (an average home’s lifespan is estimated at around 40 years). A two-bedroom Sydney high-rise unit, with lower occupancy and energy targets, can expect to save between $3,273 and $3,451, or between $72 and $76 a year to 2050. Results from Sydney Water analysis have found that from 2007-08 to 2010-11 the sample of BASIX dwellings assessed had achieved 41%, 38%, 36% and 36% in drinking water savings. 84% of BASIX homes have a tank or recycled water supply for toilet use, laundry use and/or irrigation.
Other statistics include:
• 32% and 29% respectively of all BASIX homes have installed taps and toilets with a 4 star WELS ratings (behind the 3 star requirement); and
• 31% and 38% respectively of all BASIX homes have installed clothes washing machines and dishwashers with WELS ratings of four stars or higher.
UTILITY • MAY 2014 WWW.UTILITYMAGAZINE.COM.AU 34
FIGURE 3: AVERAGE PERTH RESIDENTIAL WATER END USE BY AREA (%)
Water Efficiency in Focus

INNOVATION
Innovative technologies such as smart metering and big data have the potential to increase efficiency and productivity in the industry through:
• Reduction in under billing caused by undetected meter degradation
• Earlier identification of leaks
• Frequent, timely and actionable provision of information empowering customers to better control and understand their water use.
Both small and large utilities servicing cities and regions are either trialling or planning the roll out of meters to about 60% of Australia’s population. As smart meters gather significant data, combining this with the power of social media could transform customer services and water use behaviour.
For example, householders in Perth engaged in the Water Corporation’s H2Ome Smart program have access to a web-based dashboard showing their water use in real time and that of others in the program. Participants are saying this information encourages them to work hard to improve their position on the leader board. They are also using the real time data to compete with family members.
Another innovative program is the Smart Approved Watermark, which is
CASE STUDY FIVE – WORKING WITH COUNCILS TO PROVIDE VALUED WATER SOLUTIONS
Sydney Water’s Council Partnership Program (CPP) continues to work with councils to help small businesses improve their water management efficiency. The CPP has achieved water savings of 2142 kL/day since it was launched in June 2009.
Paul Mulley, Sustainability Specialist in Business Planning and Capability said, “Since the program started we have worked with 18 Councils and recently engaged two more; Blue Mountains City Council and Pittwater Council.
“We have trained 30 council project officers in business water auditing and co-funded employment of 16 water efficiency project officers. The program was developed as a more cost-effective way of working with our small to medium business customers to support the delivery of water efficiency targets.
“The council officers work within their local community to provide water efficiency advice to small business owners. A further benefit of this program is developing strong networks and working relationships with councils who are important stakeholders for Sydney Water.”
Australia’s water conservation quality mark label for efficient products and services.
CONCLUSION
Using water wisely will always be a necessary part of the water security equation in Australia. Utilities will continue to evaluate and offer options to customers to help them make choices about their own water efficiency targets. Programs such as Smart Approved Watermark, the Water Efficiency Labelling and Standards Scheme, and BASIX in NSW are now well-established programs that will need to continue and be built upon. Permanent water savings rules are a common sense approach and can be compared to the ‘Do the Right Thing’ litter campaigns of the 1970s and ‘80s; these programs have ‘hard wired’ savings for the future.
An added bonus is that using water wisely improves our industry’s productivity by delaying investment in future capital projects. Helping a customer to reduce their water use should indeed be considered as much of a ‘service’ as supplying a customer with water.
Note: This article has been adapted from an information paper by the Water Services Association of Australia (WSAA) and is used with permission. For more information and additional resources, please visit www.wsaa.asn.au
References:
Amos, M (2012), ‘Presentation to the WSAA Water Efficiency Network Meeting’, Energy Networks Association.
City West Water (2009), ‘Luxury showers with saving powers: Premium Showerheads Co-Funding Case Study’, Melbourne.
Kenway, SJ, Priestley, A, Cook, S, Seo, S, Inman, M and Gregory, A (2008), ‘Energy use in the provision and consumption of urban water in Australia and New Zealand’, CSIRO and Water Services Association of Australia.
McNair, B and Ward, M (2012), ‘Willingness to pay research project’, final report, Australian National University, prepared for the ACTEW Corporation.
NSW Government, Planning (2011), ‘Five year outcomes summary: BASIX building sustainability index’, NSW Government, Sydney.
Tickler, P (2012), ‘Partnering with the Water Corporation to reduce household water use’, Greensense, 17 April, viewed 30 August 2013, <http://www.greensense.com.au/partnering- with-the-water-corporation-to-reducehousehold-water-use/>.
Water Corporation (2010), ‘Perth residential water use study 2008/09’, Water Corporation, Perth.
WSAA 2013, ‘Using water wisely’, position paper, Water Services Association of Australia, Melbourne.
WWW.UTILITYMAGAZINE.COM.AU UTILITY • MAY 2014 35
WATER
MEETING EXTREME DEMAND
The October 2013 bushfires stretched water demand to the limit, with flowrates in the Blue Mountains town of Springwood peaking at around 30 megalitres per day, compared to an average of around four megalitres per day. Sydney Water was well prepared.
Conditions in October 2013 were perfect for a serious bushfire in the Blue Mountains.
The Bureau of Meteorology reported that September 2013 was the warmest on record for NSW. This coupled with high fuel loads, extreme temperatures, dry and windy weather provided dangerous conditions.
The fires that eventuated were the worst in New South Wales since the 1960s. In the Greater Blue Mountains Area over 65,000 hectares (160,000 acres) were burnt out. One hundred and ninety-three properties were destroyed and 109 were damaged in the lower Blue Mountains at Springwood, Winmalee and Yellow Rock.
PLANNING
As part of routine preparations for the bushfire season, Sydney Water carried out a program to locate and ensure the operability of fire hydrants in high risk bushfire areas.
Sydney Water worked collaboratively with the Rural Fire Service (RFS), State Emergency Service, Sydney Catchment Authority and other fire agencies prior to the fire season to ensure operational readiness to deal with bushfires if and when they occurred.
Part of these preparations included the identification of the best points on the water network where water can be reliably drawn by the firefighting agencies. Locations on the larger trunk mains are typically preferred as they are a more reliable source in times of extreme demand, such as during a fire emergency. While it is understood that firefighters will attempt to access any water source when attempting to protect property, if too many tankers attempt to access water from the smaller mains that supply households directly, this can lead to situations where there is no water available for short periods as the capacity of the mains is exceeded.
Sydney Water, through its telemetry system IICATS, has pre-determined Bush Fire Operating Protocols that automatically raised the level in critical water reservoirs to ensure the maximum amount of water possible is available. These protocols are implemented automatically whenever a total fire ban
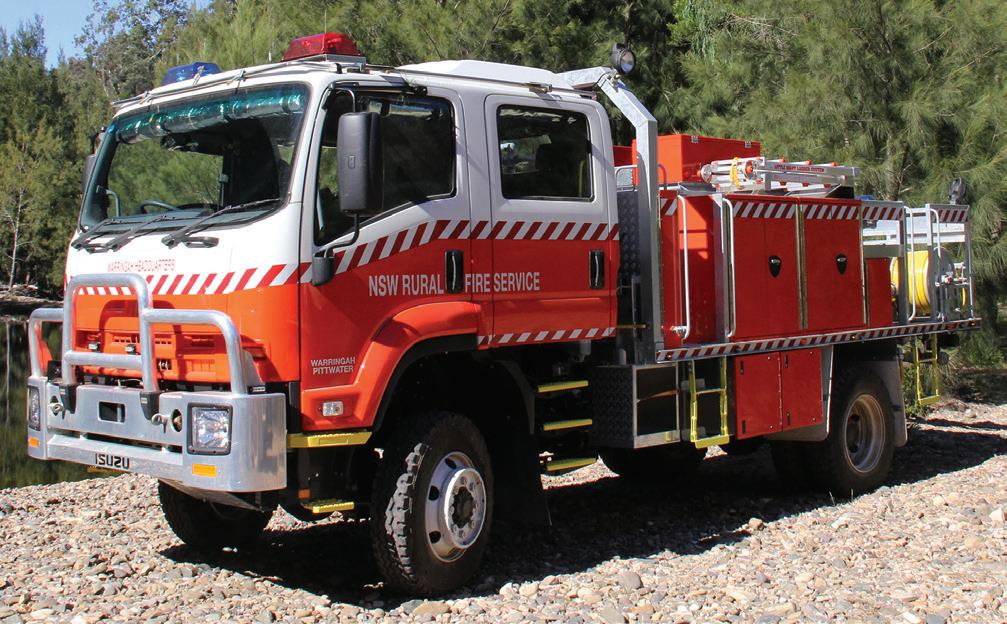
is issued via the System Operation Centre in preparation for potential firefighting.
“Sydney Water systems have been well designed,” said Gary Hurley, Manager, Networks, Sydney Water. “Our system has been robustly designed, with adequate capacity in our storages and built-in redundancy in the pipes and pumps, well supported with critical spares to ensure that the intense demands that eventuate during firefighting can be managed. Of course there are limitations but generally the systems can deal with most situations.
“When we are dealing with active fires we deploy operational specialists to monitor the performance of the system and to make the necessary adjustments so that as much water as possible is directed to the areas of highest priority,” said Mr Hurley.
A demonstration of the demands that developed during the firefighting can be seen from a comparison of a typical day in Springwood where customers may use four megalitres of water per day, compared to the flow rates measured around the time of peak firefighting that equated to a demand of 30 megalitres per day for the same area.
HOW IT WORKED
To cater for the peak demand in the Blue Mountains area during the fires, the Sydney Water system allowed the
UTILITY • MAY 2014 WWW.UTILITYMAGAZINE.COM.AU 36
WATER
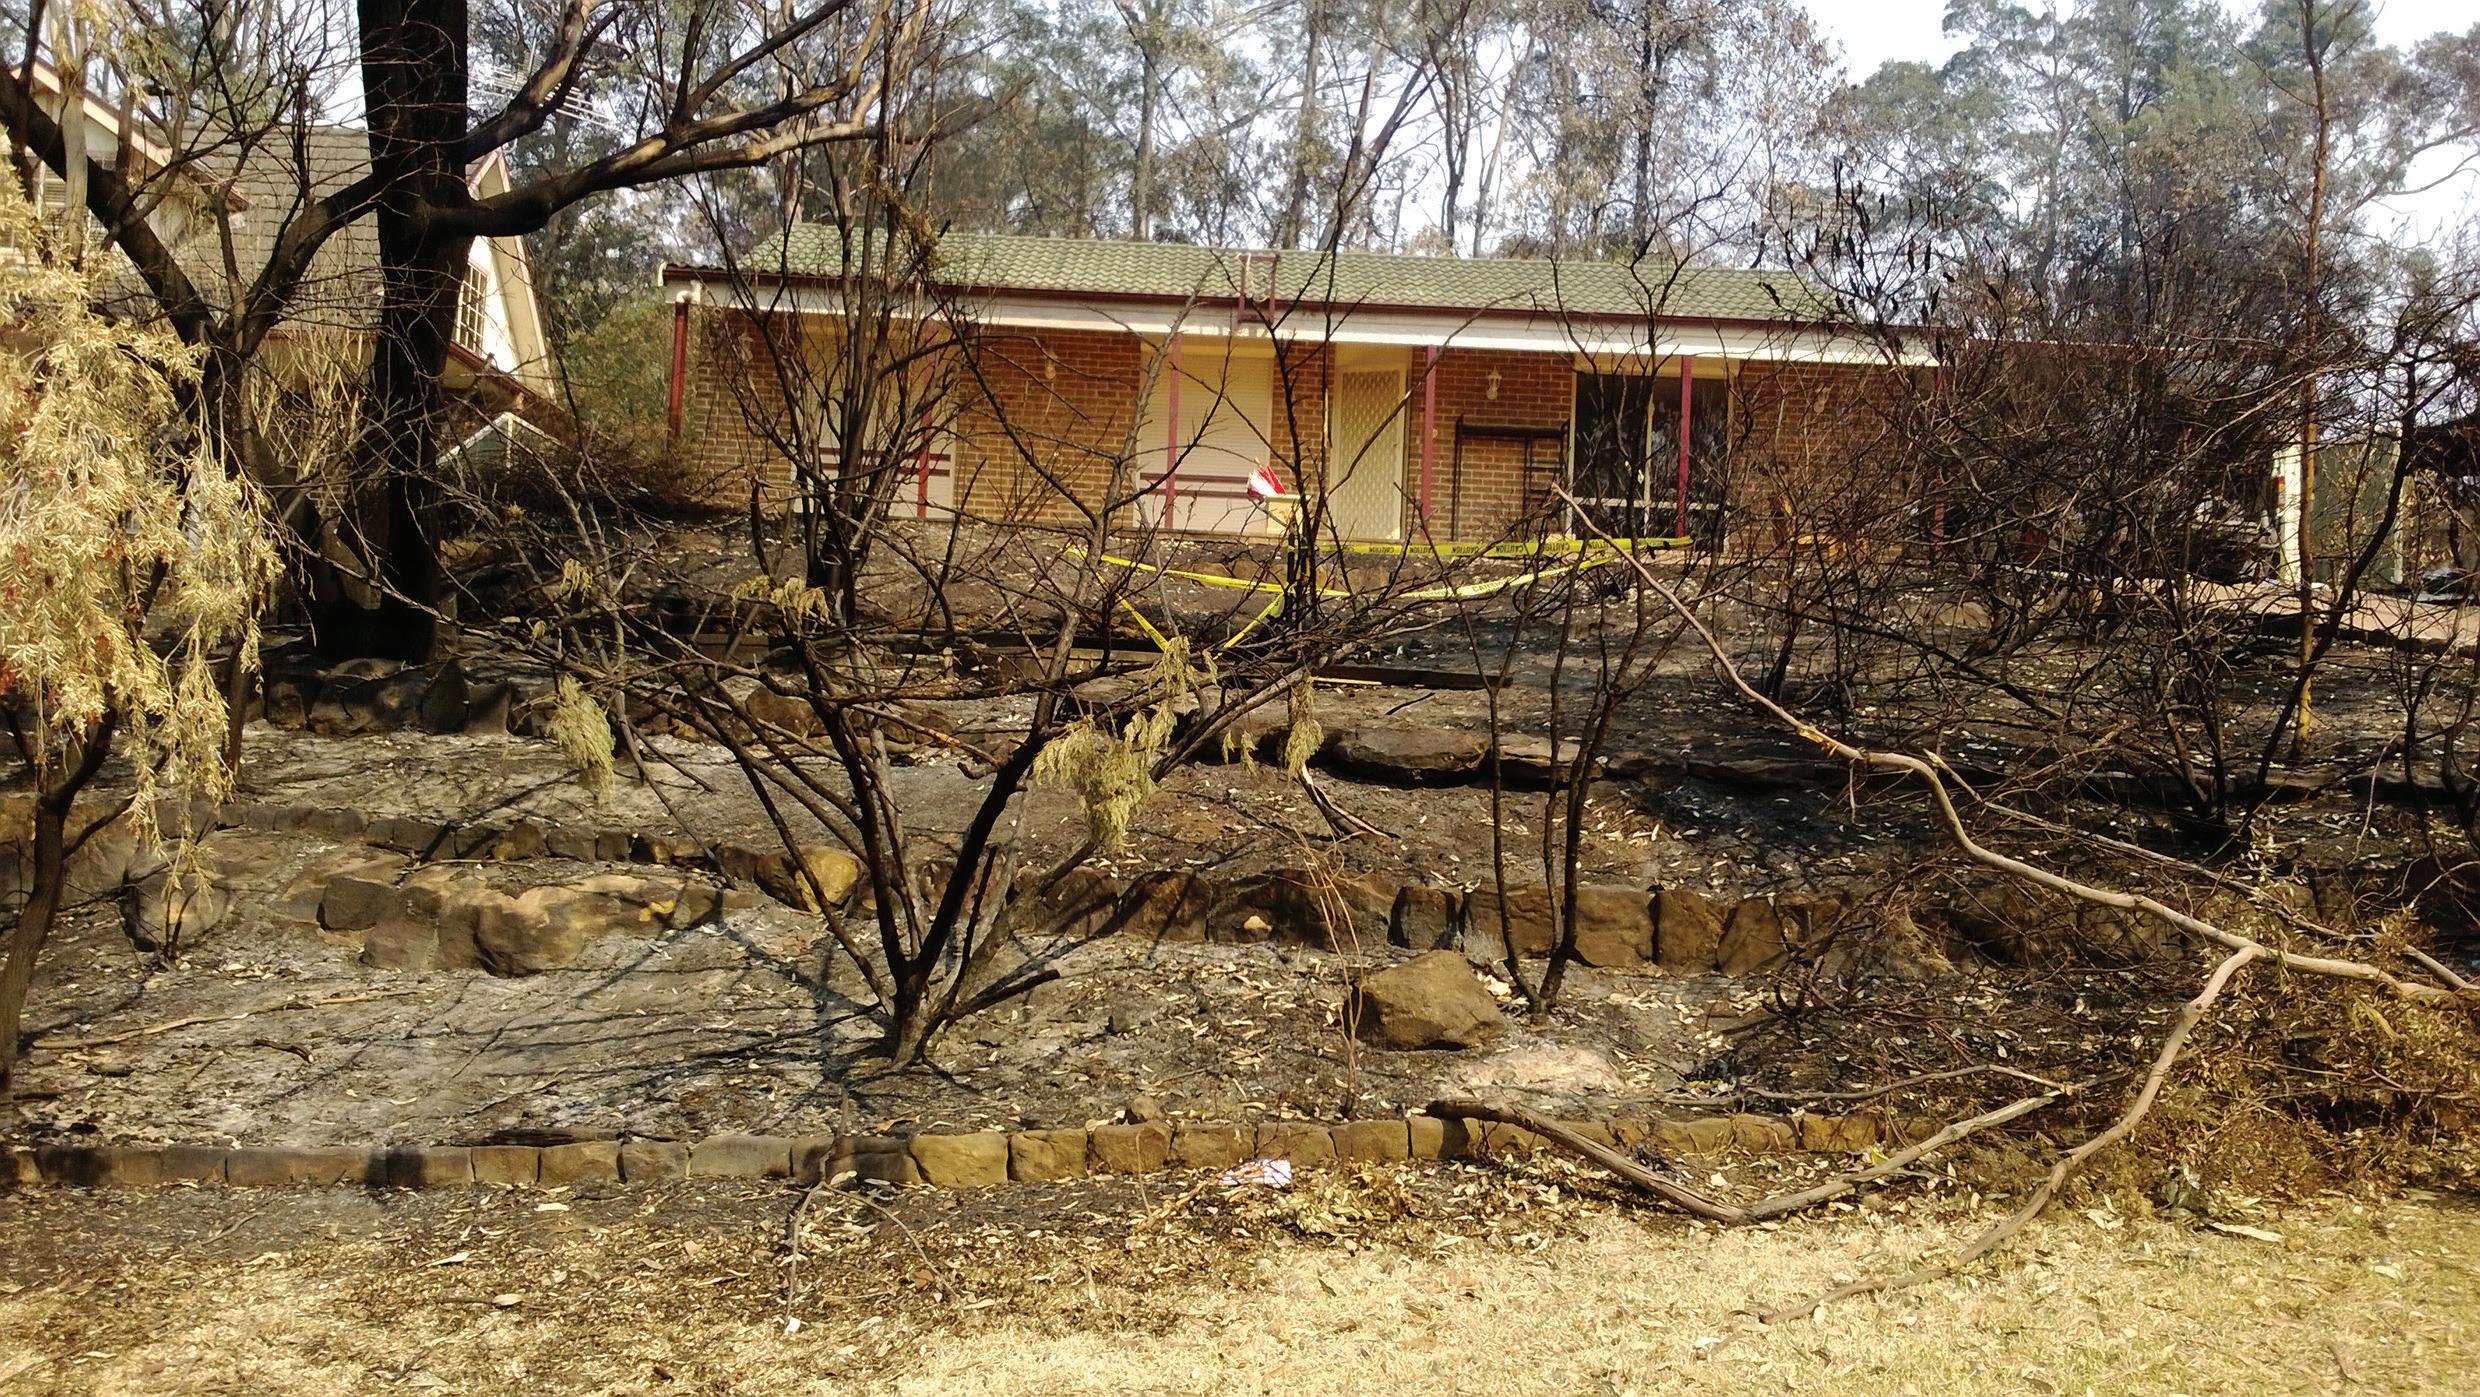
operational flexibility to pull water from a variety of sources.
The system is designed to provide water from both the top of the mountains and from the plains below. Water was transferred down the mountains from a small water treatment works located at Cascades, near Katoomba. This allowed water to be supplied as far down as Faulconbridge. A large pumping station located near Penrith allows water to be pumped uphill to areas around Springwood and beyond.
“The 21st of October 2013 was the busiest demand for water in the Blue Mountains area for 10 years”, said Mr Hurley. “Sydney Water specialist operators needed to actively monitor and keep operationally juggling the levels through the Blue Mountains so that water was constantly pushed to areas where it was needed.
“Sydney Water deployed operational staff to work within the fire control centres so that water could be directed to where it was most needed and to coordinate any activity to support the firefighting effort that was required”.
IMPACT ON WATER RESERVES
There was no significant impact on water reserves due to the firefighting effort.
Sydney Catchment Authority can move water from as far away as Oberon to provide water to the areas if required.
Eric de Rooy, General Manager, Service Delivery at Sydney
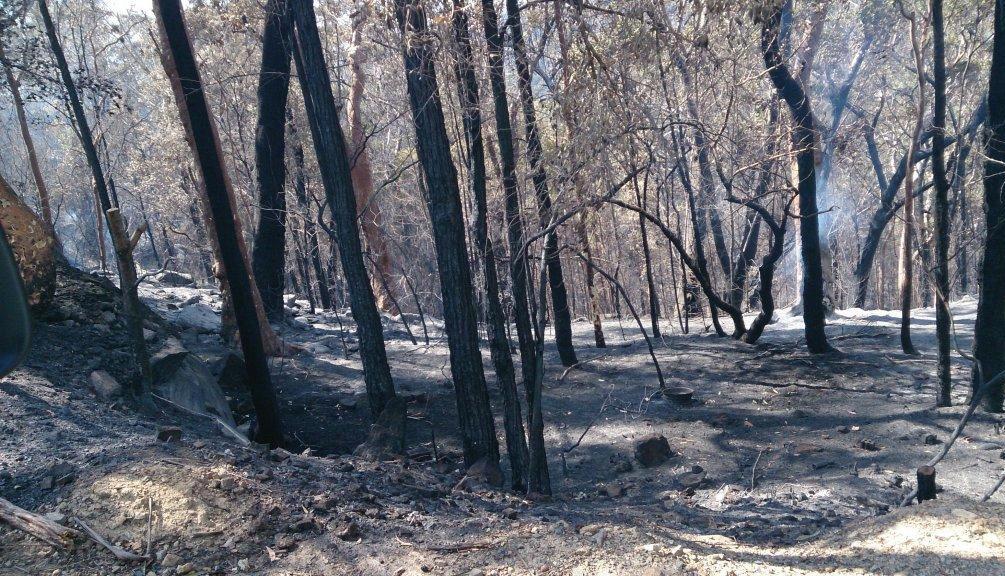
Water, said, “Questions are often asked that if Sydney residents minimise their water consumption during periods of firefighting in the Blue Mountains whether that will help with water pressure for the firefighting effort.
“The potential water pressure in the Blue Mountains is established when the system is designed and built and is manipulated by adjusting the level of water in reservoirs in the Blue Mountains. They are a separate system to the system in the city,” said Mr de Rooy
“We should always be water wise and there are water wise rules in place which give people advice on how they should be efficient with water, but the level of water use by
WWW.UTILITYMAGAZINE.COM.AU UTILITY • MAY 2014 37
WATER
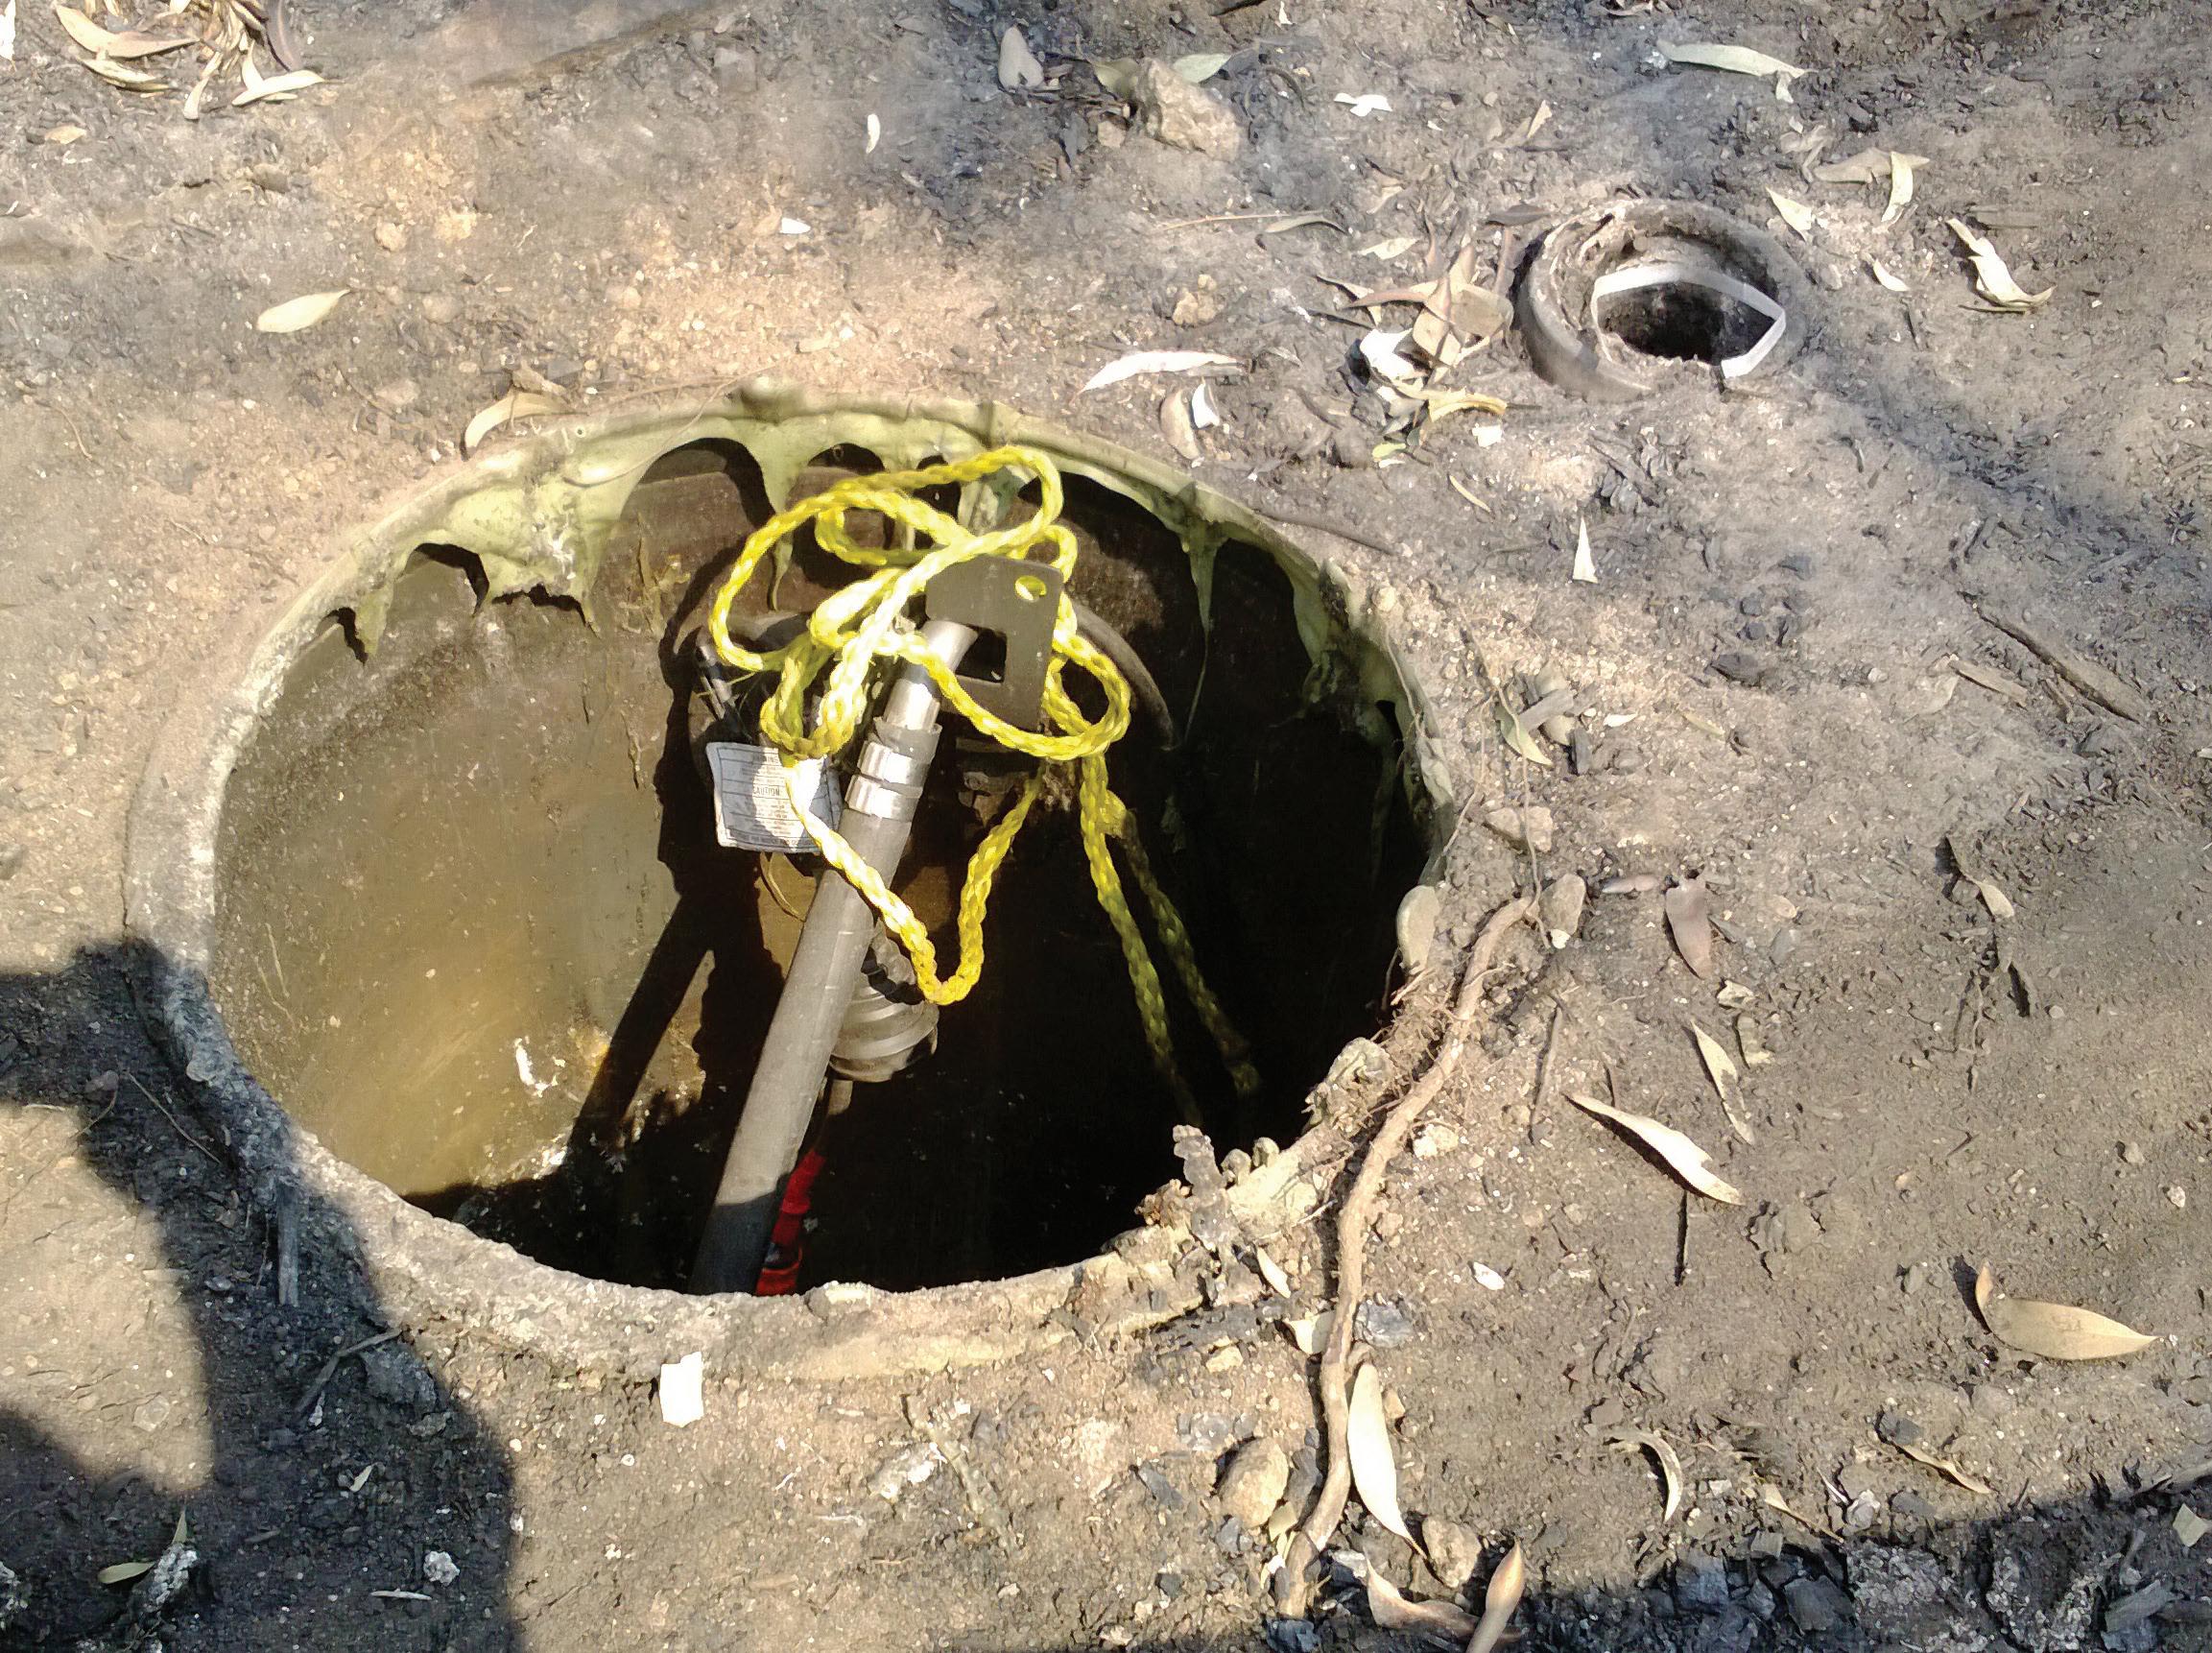
people in the Sydney area will not help with water pressure in the Blue Mountains in periods of high demand such as those occurring during fighting a bushfire,” said Mr de Rooy.
THE RECOVERY
As part of Sydney Water’s Priority Sewerage Program, pressure sewerage systems had been installed in a number of outlying areas around Sydney, including 238 at Yellow Rock in the Blue Mountains.
The fire burnt the lids on top of the pressure sewerage system pots located in each property which then fell into the pot, burning the inside of the pot and all other items above the water line. PE pipes and mains also melted and in some cases the heat of the fire burnt through the pressurised main causing leaking sewage to become another hazard in the area.
The loss of the pot lid created an onsite hazard, with a 1m diameter, 2m deep hole appearing in people’s yards. Another major hazard was exposed electrical wires due to the above ground wiring and control box being melted from the heat. Since the area power grid was down, following the loss of power poles to the fire, Sydney Water was able to neutralize this hazard quickly before it became a life-threatening situation when power was restored.
The recovery phase commenced as soon as personnel
could gain access to the area.
Generators were introduced to run the wastewater pumping facilities so that system capability could be restored.
The first stage of the wastewater recovery was to repair the systems at the 28 houses that where habitable. The second stage was to make safe the installations at the 56 houses that had been completely destroyed. The remaining 154 properties resumed normal operation as soon as power was restored by the supply authority.
The missing wastewater pot lids and the live electrical wires were seen as the most pressing safety hazards and were targeted to be repaired first.
Damaged water meters where also identified as a priority for repair due to the potential electrical hazard from property earthing systems and the need to restore water supplies to the properties. Sydney Water operations personnel issued bottled water to customers who had lost water services and also kept the locals advised of their actions until we could restore the water to the houses that were still habitable. Water was restored to houses within 24 hours.
Temporary repairs to make safe the damaged wastewater pots was immediately implemented with electricians addressing the electrical risks and plywood covers being used to reduce the risk of falling into open pots where the lid had been damaged. Once power was restored to the area, many
UTILITY • MAY 2014 WWW.UTILITYMAGAZINE.COM.AU 38 Meeting extreme demand
WATER
of the pressure sewerage systems attached to unaffected houses resumed their normal operation. This required more licensed plumbers to be engaged at short notice to repair leaks in the sewerage system caused by the fire.
Contractors were engaged to re-install the full pressure systems to service the 28 partially damaged properties.
THE AFTERMATH
In response to whether or not there was an ongoing issue with water quality following bushfire activity due to the volume of embers and ash that could have entered the major storages, Mr de Rooy said “Sydney Water’s water treatment works are designed to cope with the amount of debris that entered the supply. There have been no issues with treatment in the Blue Mountains during or after the firefighting efforts”.
There was no charge to the RFS for water-use during the firefighting and no charge to local residents.
Sydney Water has engaged an external engineering consultant to review the performance of its water supply system to the Winmalee and Yellow Rock townships during the bushfire event on 17 October. This review will analyse how the water supply system performed on the day and recommend any improvement opportunities that may arise from this analysis.
“This will allow us to identify improvements in operating practices or adjustments to improve system performance,” said Mr de Rooy. “Sydney Water’s job is to support the efforts of the RFS and the community in any way we can.”

WWW.UTILITYMAGAZINE.COM.AU UTILITY • MAY 2014 39
Sydney
WATER Meeting extreme demand
Blue Mountains Springwood


INNOVATION FOR THE FUTURE OF THE WATER INDUSTRY DIGITAL WATER

South East Water has investigated the next generation of water metering through innovative technological advancements in recent years in an effort to pursue efficiencies and outcomes.
“We saw an opportunity to be more proactive in the identification of leaks for our customers and incorporating innovative and forward-thinking technology into our business is always at the forefront of our minds,” said South East Water Managing Director, Kevin Hutchings.
The advanced technology reads the volume of water that enters a property in 30-minute intervals and wirelessly transmits water consumption data to a central gateway. South East Water then integrates this data into its technology systems. Several trials are now investigating and evaluating differing technologies. One of the technology trials implements a meshed network, whereby the meter transmits data over a radio communications link. The network has been designed
for information flow in both directions: meter-to-gateway and gateway-to-meter. The meters transmit information from one another and then to the gateway through increased connectivity, providing greater area coverage and reduced dead spots. Consequently, if a property’s consumption pattern appears abnormal, technicians can direct the meter to conduct more frequent reads in an effort to identify a leak.
“Currently, contractors go out on foot and conduct manual reads of over 673,000 commercial and residential mechanical meters. This enhanced communication link used in the digital water meters not only provides water readings in 30 minute intervals, but also all but eliminates the need for on-site meter readings. The greater frequency of reads generated by this new technology means that we can alert customers to any potential leaks much faster than ever before,” said Mr Hutchings.
Using a SCADA system to control and monitor the
UTILITY • MAY 2014 WWW.UTILITYMAGAZINE.COM.AU 40
WATER
Victorian water retailer South East Water has observed strong early indications of consumer, financial and environmental benefits through innovative digital water meter trials in Melbourne’s south east.

METERS:

network, the technology collects data from the field and populates a statistical portal. The system enables computer algorithms to check for trends in the data, monitor consumption patterns and identify abnormalities.
Unlike electricity smart meters, digital water meters do not require mains power, cannot cut off the supply of water and can be replaced with minimal disruption to households. The digital water meters can detect reverse flow, trigger alerts and monitor trends.
Initial testing of the digital water meters in Belgrave South sought to facilitate a better understanding of how this type of technology might be used across South East Water’s service region in the future.
“Trialling the next generation of water meters will allow us to identify the most efficient way of keeping customers informed about their water use. With over 13,000 kilometres of water pipes, it will also help us to optimise the water

WWW.UTILITYMAGAZINE.COM.AU UTILITY • MAY 2014 41
WATER
VICTORIAN MINISTER FOR WATER PETER WALSH AND SOUTH EAST WATER MANAGING DIRECTOR KEVIN HUTCHINGS DISCUSS THE CUSTOMER PORTAL.
Digital water meters: innovation for the future of the water industry

VICTORIAN MINISTER FOR WATER PETER WALSH AND SOUTH EAST WATER MANAGING DIRECTOR KEVIN HUTCHINGS
DISCUSS THE DIGITAL WATER METER TECHNOLOGY.
network and focus future investment in water infrastructure where it’s needed most,” said Mr Hutchings.
Testing of the digital water meters in Belgrave South identified that 12 per cent of water supplied to properties within the trial area was lost due to water leaks. Once the testing revealed that data collection and analysis could improve leak detection, South East Water continued to explore digital metering options, communication networks and possible customer benefits through the expansion of the trials.
South East Water has now expanded its trials to three additional sites in South Yarra, Seaford and Caulfield. These locations were selected due to their terrain, housing density and access to property meters and other required infrastructure like utility power poles.
To complement the digital water meters’ functionality, some residents involved in the trials will soon have access to an online self-service environment which will display their daily water consumption.
“Customers participating in the trials will soon be able to view their daily water use, for the first time, at South East Water’s prototype online self-service environment. Through the site, customers will be able to explore their daily water use, compare water consumption to other households participating in the trials within their suburb and set water use targets,” said Mr Hutchings.
The South East Water digital water meter technology has been identified as an innovative step forward by one of the most significant voices in the industry today. Victorian Minister for Water, Peter Walsh visited one of South East Water’s digital water meter trial properties in Seaford on 5 March 2014. Mr Walsh said the trials have demonstrated the customer benefits that can be gained through the use of the technology.
“This innovative technology means leaks are detected quickly – in some cases where they might not have been detected at all, or for a number of years,” said Mr Walsh.
BENEFITS OF DIGITAL WATER METER TECHNOLOGY
Detecting water leaks: Early detection of water leaks in a property’s internal plumbing or a water appliance (e.g. toilet or hot water system) will help save drinking water supplies and reduce customers’ water bills.
Meter reading accuracy: Currently, water meters are read manually every three months by field operators. In some cases access to a water meter on property is not possible – having a digital water meter installed will remove the need for manual reads.
Reduce water bills: In the long-term, digital water meters have the potential to create efficiencies in a network, which could lead to reduced water bills by decreasing the costs associated with unaccounted water.
Life span: Digital water meters have a longer lifespan than mechanical water meters as they do not have any moving parts that deteriorate over time. Manually-read water meters have a life span of seven – ten years before accuracy may start to diminish. With no moving parts, digital water meters are tested to last longer than mechanical water meters.
“For example, at this property here today, South East Water immediately identified irregular consumption patterns when a trial meter was installed in January.”
Mr Walsh inspected the digital water meter on the property and discussed with Mr Hutchings the savings experienced by the Seaford customer through the detection of leaks.
The trials identified two running toilet systems at the Seaford property, which was leaking a total of 240 litres a day. Mr Hutchings said the customer was not aware of the severity of the leak, and the cost that it was adding to her bill.
“The volume of water loss identified on this customer’s property is equivalent to nearly two bathtubs of water loss a day – this was 34 per cent of the customer’s total daily water consumption. If left unidentified, this leak would have been enough to fill over two average swimming pools within a year and added over several hundred dollars to the customer’s annual bill,” said Mr Hutchings.
Through the digital water meter technology, leak detection algorithms identified that ten per cent of properties within the Seaford trial area were likely to have water leaks. Several other customers involved in the trials have seen results from early leak detections. A cracked galvanised pipe underneath a customer’s house in Seaford was identified to be leaking 7,276 litres of water per day – this is equivalent to 61 bathtubs of water loss per day. The leak would have added $3,400 to the customer’s bill for the relevant quarter had it not been identified through the technology and subsequently fixed.
And a defective hot water service at a customer’s
UTILITY • MAY 2014 WWW.UTILITYMAGAZINE.COM.AU
42
WATER
Digital water meters: innovation for the future of the water industry

property in Belgrave South was identified to be leaking 480 litres of water per day – this is equivalent to four bathtubs of water loss per day. The leak would have added $317 to the customer’s bill for the relevant quarter had it not been detected and fixed.
Mr Hutchings said the new technology is an exciting prospect not only for the potential savings available to

customers, but also for the transformation of the water industry into a new and innovative space.
“The digital water meter trials have demonstrated the advancement of new technology in water retailing, which is delivering value for our customers. We are very excited about the future of our digital water meters.”

WWW.UTILITYMAGAZINE.COM.AU UTILITY • MAY 2014
43
WATER Working in HDD for energy or comms and need the qualification? 18829 - Folder Spine_Layout 1 17/10/12 3:57 PM Pag The NEW Trenchless Edition of our famous DICAT distance learning course is exactly what’s required. Contact us or scan the code below. T: (02) 9428 3444 F: (02) 9428 3555 E: office@aditc.com.au W: www.aditc.com.au
TRIAL DIGITAL WATER METER (SEAFORD).

LIFTING THE LID ON DRAIN SURVEYING TECHNOLOGY
By Gareth Hunt, Supervisor of Select Solutions CCTV Inspection Services
44 UTILITY • MAY 2014 WWW.UTILITYMAGAZINE.COM.AU INSPECTION/ CCTV

Water authorities have long struggled with the challenge of maintaining assets beneath the ground. Stormwater and sewer drains, in particular, are subject to unpredictable damage and blockages from tree roots that seek water. The results are shifting pipes which lead to severe cracking and blockages which gradually extend throughout the network.
Traditionally, these problems have been treated reactively with a degree of guess work. Where a blockage is identified the action taken was to clear it and hope that the problem goes away. This may involve using methods such as machine rodding cutting to remove tree roots which would halt the immediate problem but without understanding the damage already caused.
Cameras have proven a significant advancement for the plumbing and building industry to be able to inspect pipes and identify causes of blockages, to pinpoint problems and prioritise maintenance works. As with all technology, cameras and associated equipment are continually evolving. We have moved from VHS to CD, to digital storage; and with these advancements, the quality and detail of the images captured are evolving as well.
With current camera technology, operators can easily identify damage and its cause meaning they can accurately decide which method of cleaning or repairing will be most effective – high pressure water jetting, rodding, or sewer machine cables for instance. In the past, an incorrect decision could be costly. For instance, high pressure water would be effective in clearing a blockage, but if concrete piping is in the early stages of corrosion, this process may blast away the surface, dramatically reducing the life span of the drain. For this reason the use of camera technology has become a critical tool in inspection and assessment.
Select Solutions, a multi-utility service provider working closely with a number of Australian water authorities in sewer and pipe maintenance, has experienced the advancement of surveillance technology firsthand. Damian Bradley, Select Solutions Plumbing and Civil Group Manager, says “Prior to camera technology the extent of below-ground damage was all guess work. Now the guessing game is over.”
In fact, camera technology has proven such a vital tool that Select Solutions has embraced the latest advancement,
WWW.UTILITYMAGAZINE.COM.AU UTILITY • MAY 2014 45
CONDITION ASSESSMENT
investing in an integrated camera and software unit that delivers detailed panoramic 360-degree views from inside a pipe. Where traditional push-rod camera systems act as a video recording system allowing the operator to only see the drain in one direction as they travel through it, this latest advancement captures images from inside the drain in both forward and away directions, weaving them into a ‘flat’ picture giving a true 3D image of the pipe’s interior.
The immense level of detail captured with the dual lenses, optimal lighting at the point of capture, and ability to see all sides of an object through the woven image, gives the operator a new level of information to make informed decisions about the health of a pipe. It is possible to identify hairline cracking and other early indicators so that quick remedial action can be scheduled to prevent costly rectification works in the future.
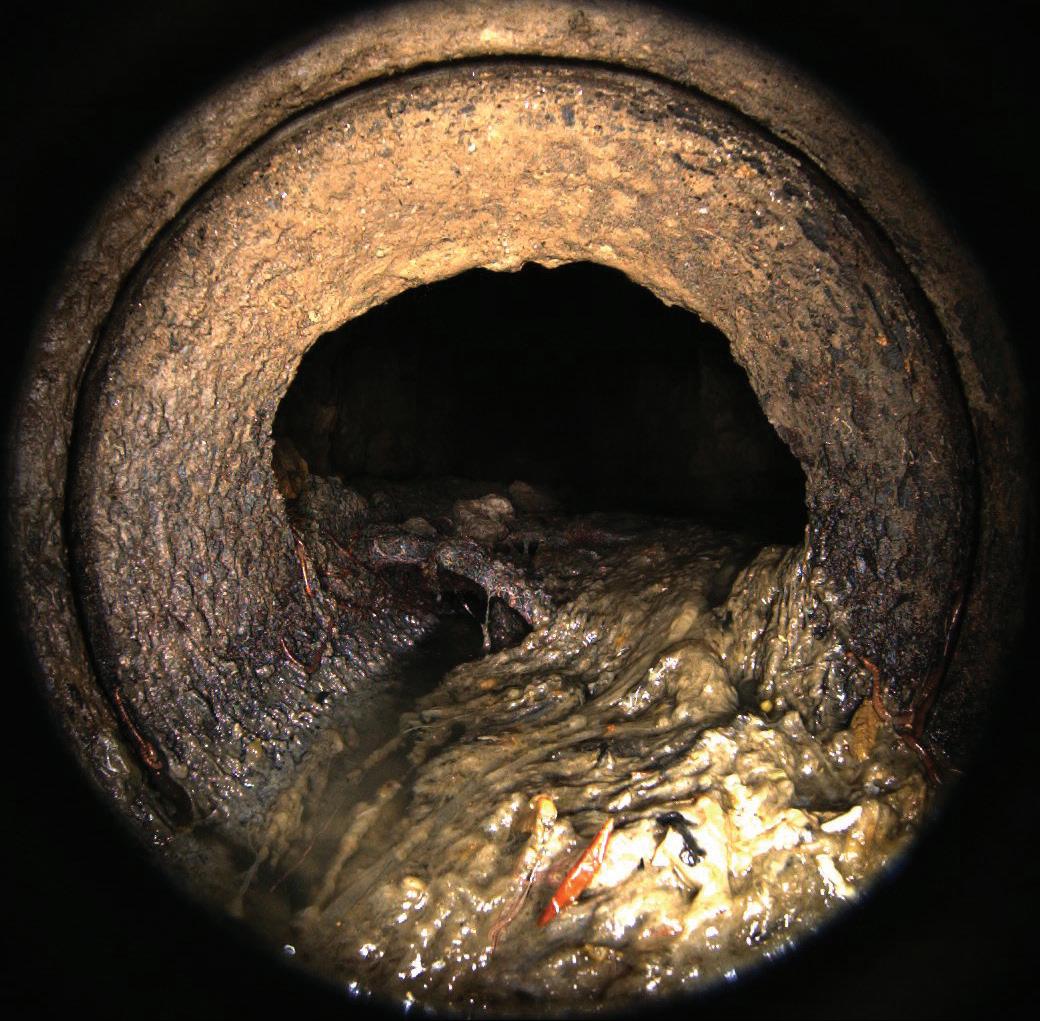
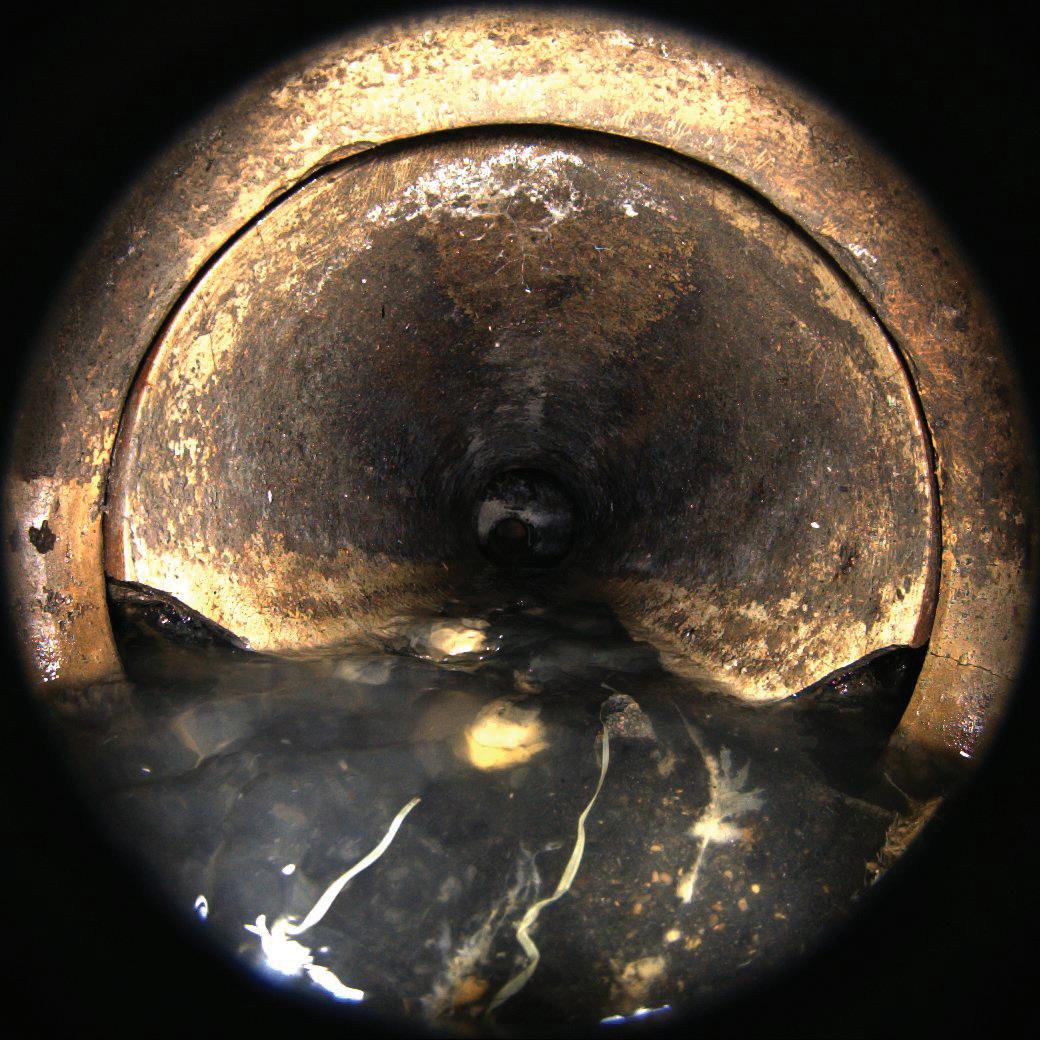
The effect is achieved by two 185-degree fisheye lenses which take high resolution photos every 5cm in both the forwards and backwards direction. The images are transmitted to the operator console and stitched together by the software to create a true 3D internal view of the pipe. This method eliminates the blurring that can occur with traditional cameras, as well as overcoming the limitations of single direction camera angles.
A further benefit of these new devices is their ability to cover hundreds of metres of straight pipe. Push-rod cameras are limited to the amount of bends or drops in the piping, whereas this new device is controlled by the computer system, either on four wheels or mounted on a flotation device. With features to zoom and pan 360 degrees, operators can look into inlets such as housing connection branches and closely examine objects such as displaced joints and
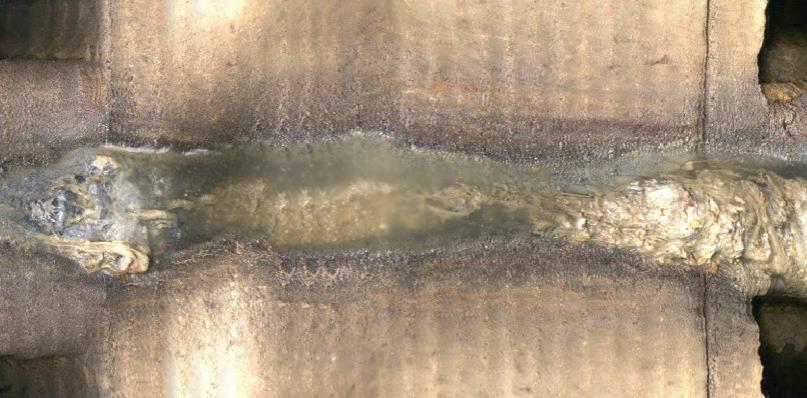
(LEFT) 3D IMAGE SHOWING DAMAGE TO PIPE
(ABOVE) FLATTENED VIEW OF DAMAGED PIPE SHOWING MISSING SECTION AT FAR RIGHT OF IMAGE

(LEFT) 3D IMAGE OF WHAT APPEARS TO BE A HEALTHY PIPE
(ABOVE) FLATTENED VIEW OF THE SAME PIPE SHOWS PLANT MATTER BEGINNING TO BREAK FINE CRACKS IN THE PIPE
UTILITY • MAY 2014 WWW.UTILITYMAGAZINE.COM.AU 46
lid
drain surveying technology INSPECTION/ CCTV
Lifting the
on
protruding pipe connections. With an option to allow vertical surveying of manholes with a separate camera, these new cameras have a clear mobility advantage over traditional CCTV systems.
For water authorities and councils, who are under constant pressure to reduce operating expenses, drain surveillance technology is enabling a shift of focus from costly rectification works on demand to a predictable model using routine inspection and schedule preventative maintenance. With each advancement in camera technology and improved imagery there are fewer pipes and drains that can’t be thoroughly examined, saving water authorities, councils, businesses and households the cost and disruption of unexpected blockages and collapses of water infrastructure.
It is possible to identify hairline cracking and other early indicators so that quick remedial action can be scheduled to prevent costly rectification works in the future.
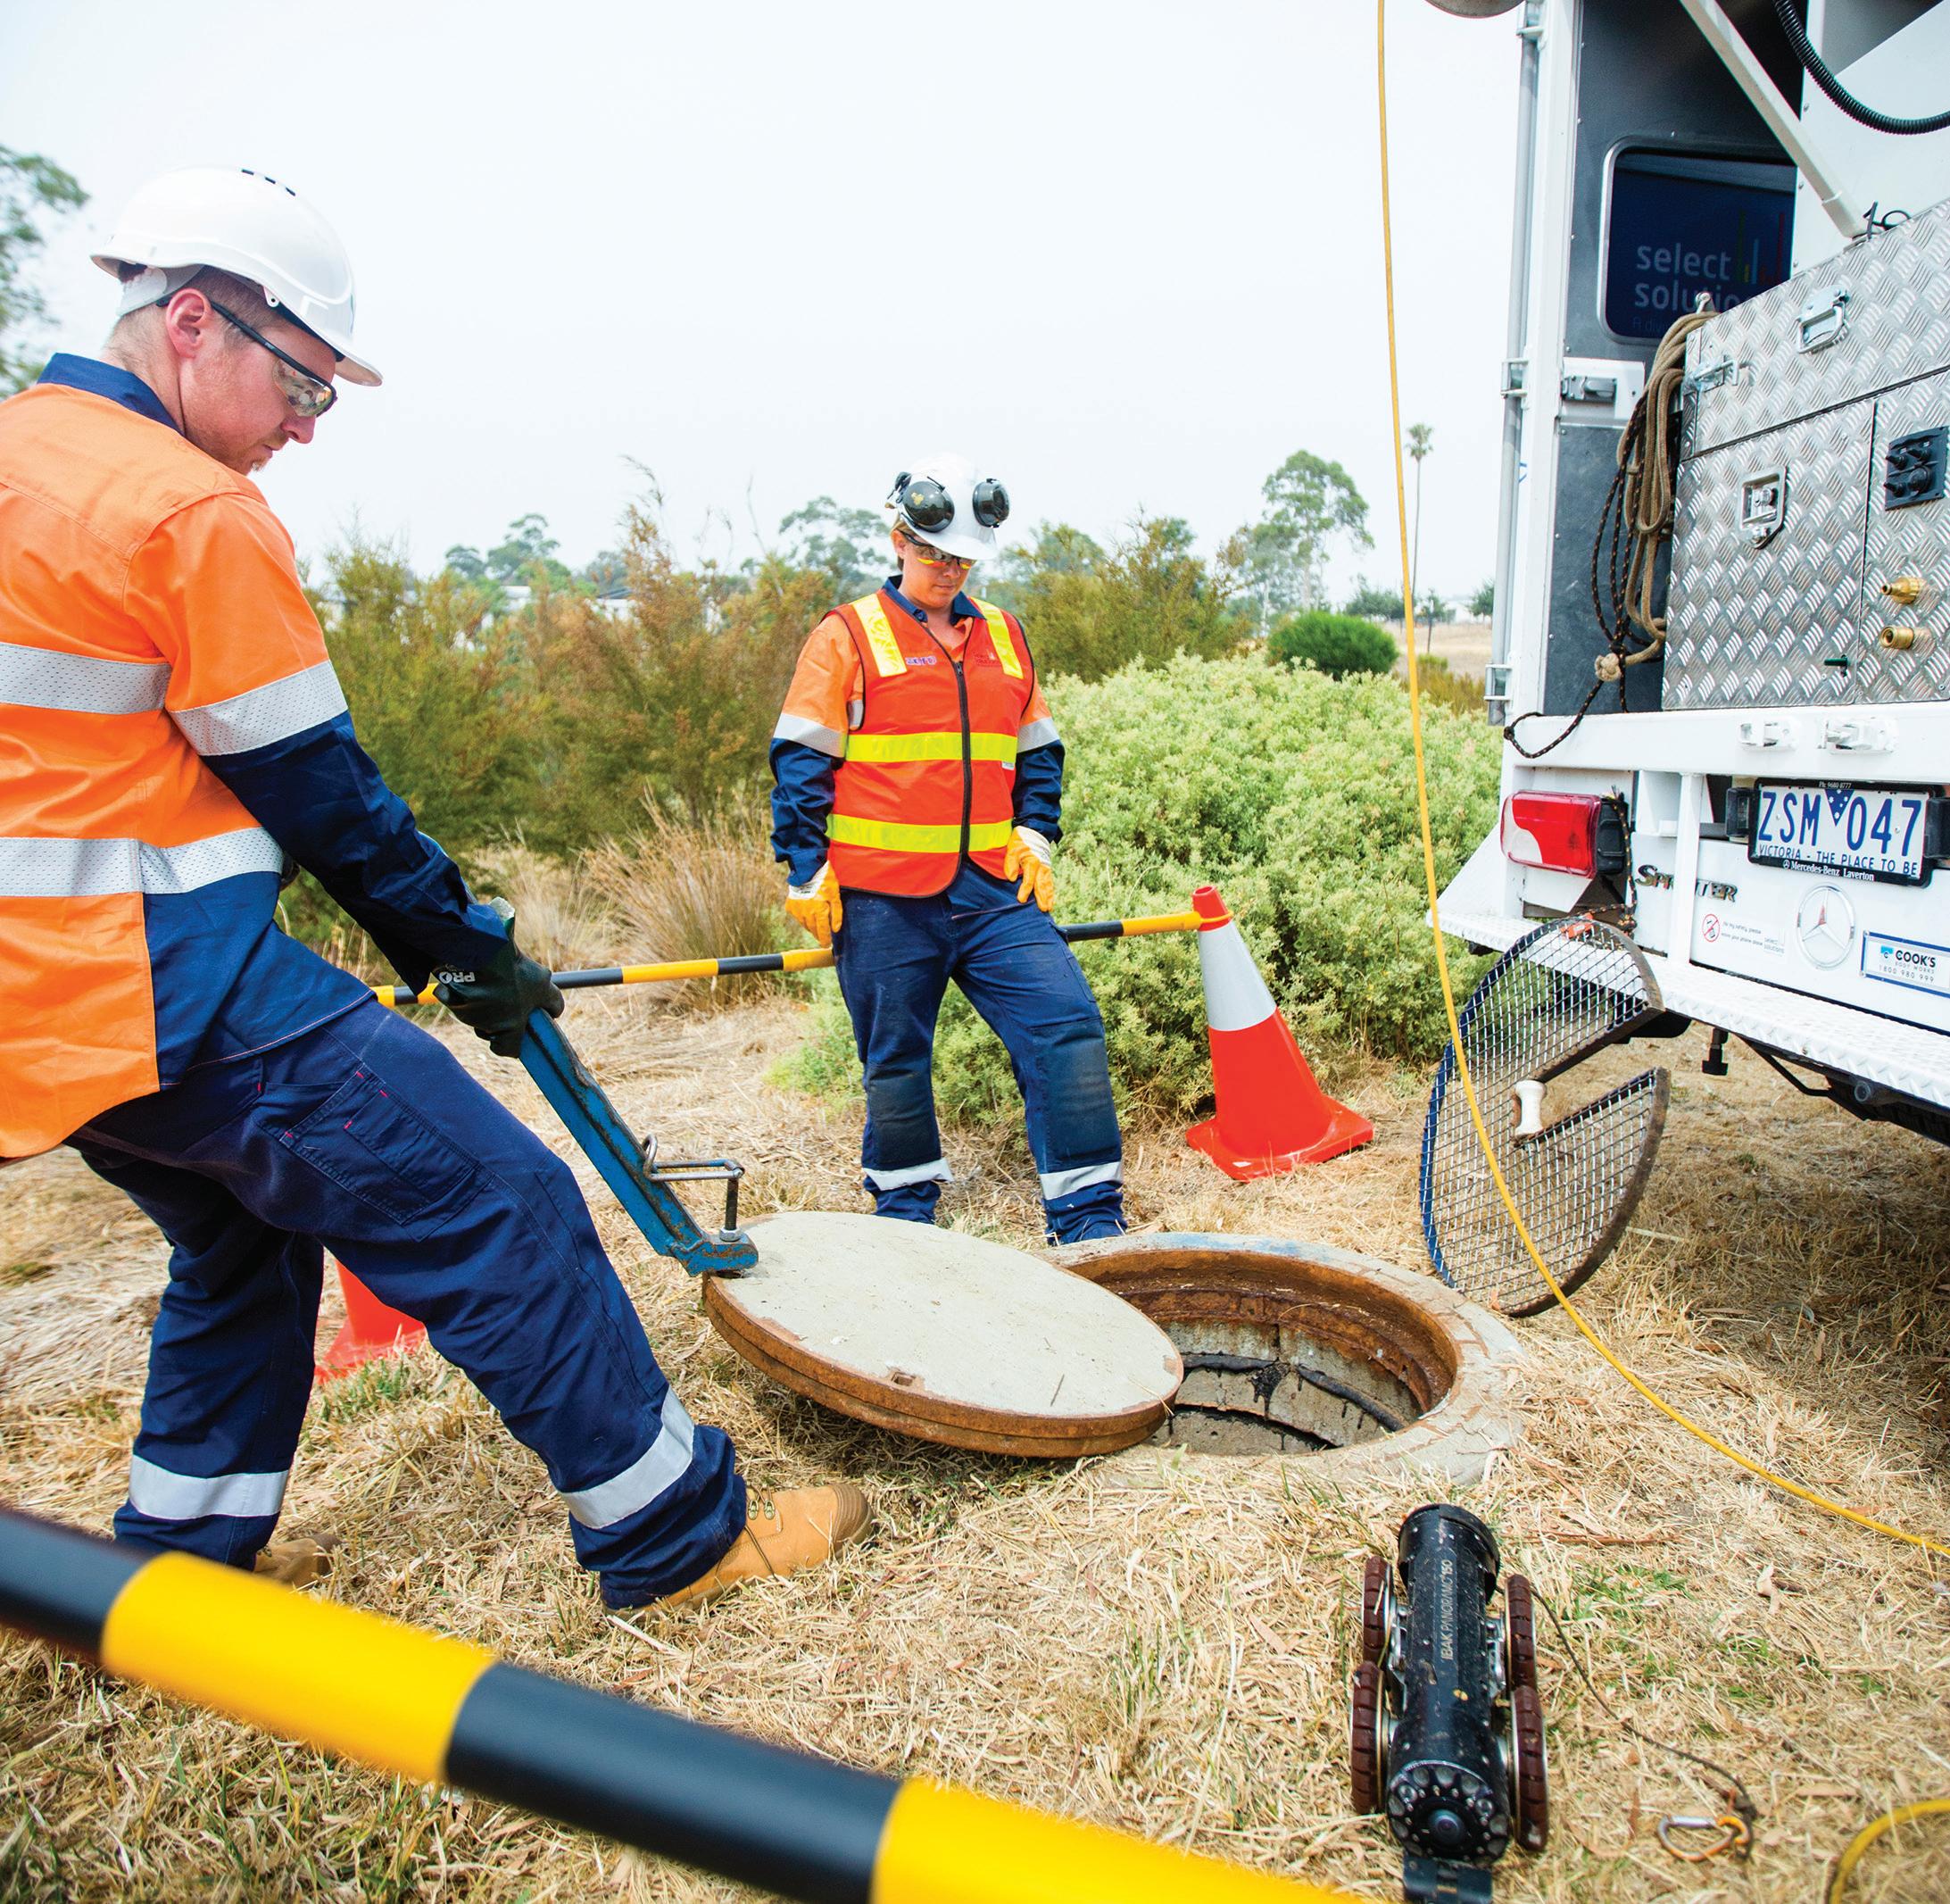
WWW.UTILITYMAGAZINE.COM.AU UTILITY • MAY 2014 47
CONDITION ASSESSMENT
Lifting the lid on drain surveying technology
KEYHOLE PRECISION
TRENCHLESS PIPELINE INSTALLATION IN CHANGING GROUND CONDITIONS
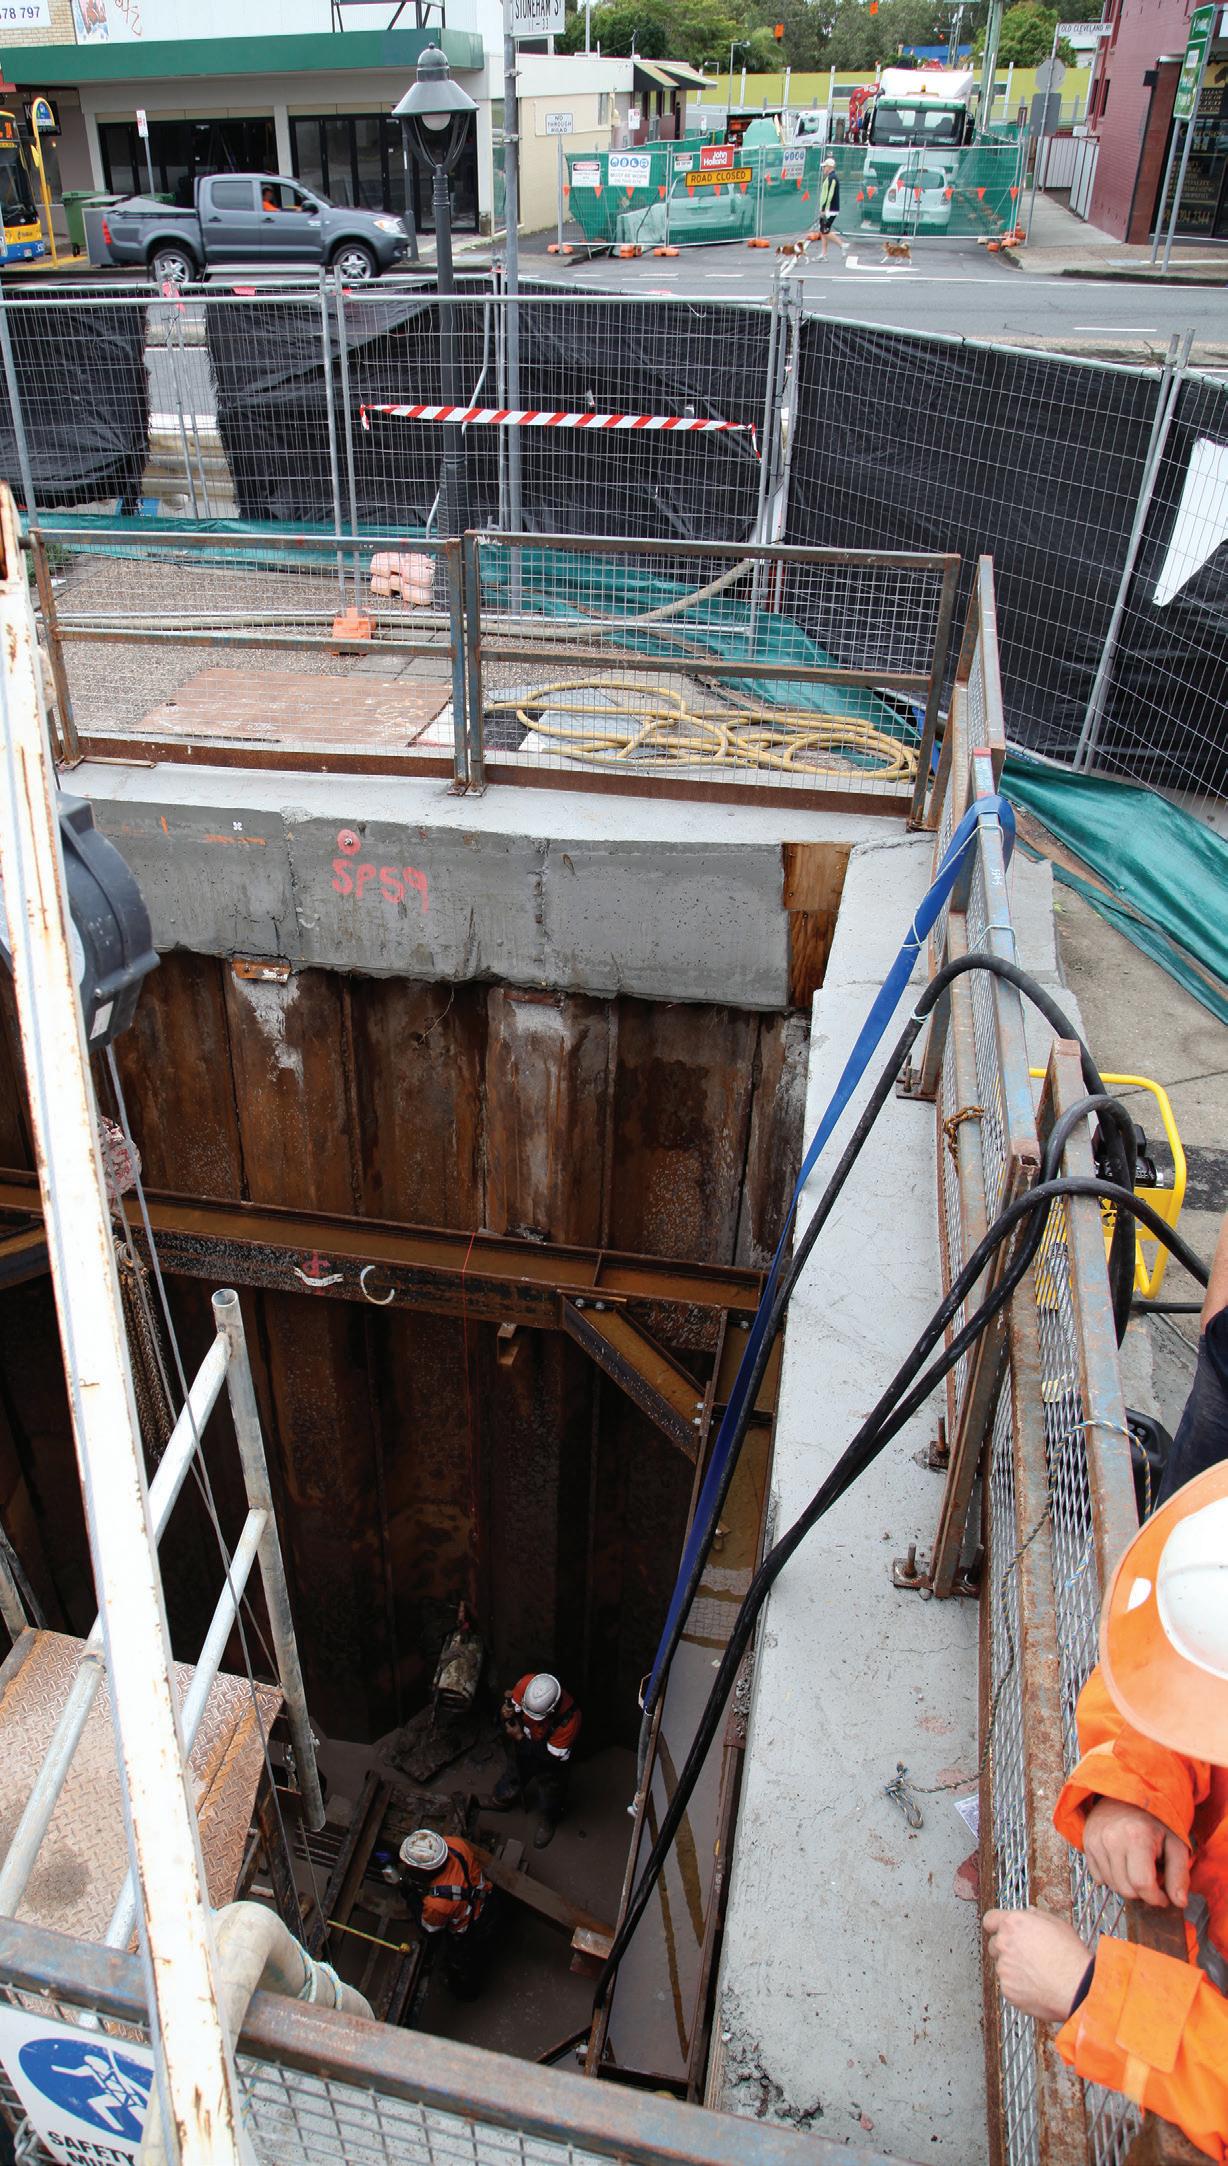
The Woolloongabba Sewer Capacity Upgrade is a major project currently being undertaken by Queensland Urban Utilities to increase capacity to cater for rapid population growth. With works taking place in a highly urbanised area, the need for accuracy in construction is non-negotiable. The challenges of such an installation are compounded when ground conditions vary. Different types of earth offer varying levels of support and often require different tools and methods for successful tunnelling.
Woolloongabba, home to the famous ‘Gabba cricket ground, is an inner suburb to the south east of the Brisbane CBD. Changing demographics mean the population is expected to increase by 80,000 in the next few years as high-density apartment living becomes increasingly popular.
The upgrade is a two-phase program, with the first phase having been completed in 2011, and the second underway from July 2012 to June 2014.
The sewerage upgrade includes the construction of three trunk sewer mains, constructed by a small-diameter tunnel boring machine, as well as various branch lines. The mains each have a diameter of 1.4 metres and will have a capacity of 5,000 litres per second, with an average of 1,000 litres per second anticipated. The pipes are built on a gradual decline, dropping one metre for every 800 metres of pipeline.
Major contractor John Holland (JHG) has been undertaking various civil works for the project and has also worked with specialist subcontractor Edge Underground to ensure accuracy for a number of on-grade drives. Existing infrastructure meant that installation had to take place in some particularly tight spots, including installing HOBAS 525mm jacking pipe under a major roadway and in high density housing.
Edge Underground, who specialise in ‘keyhole’ pipeline installation, use their laser guided boring system, Vermeer
UTILITY • MAY 2014 WWW.UTILITYMAGAZINE.COM.AU
48 MICRO- TUNNELING
Existing infrastructure meant that installation had to take place in some particularly tight spots ... under a major roadway and in high density housing.
AXIS, in order to precisely install pipeline in tight conditions.
They set up on site in July 2013 in a very restricted working site which required them to keep their footprint to an absolute minimum. As JHG diverted live sewer pipes during the procedure, the installation had to be completed quickly and accurately.
The challenge of maintaining the required level of precision was magnified by changing ground conditions in the area, which shifted from wet mud to high plasticity clay. This required Edge to use a closed faced cutter to manage the softer un-supporting ground. However, this meant slowed progress through the clay.
Nevertheless, three bores were completed, one of 70 me tres, one of 103 metres and one of 97 metres. Detailed tests, including as-built survey, vacuum and infiltration tests, and CCTV inspection were carried out. The installation passed all of these, showing accuracy of +/- 10mm for each drive, allowing JHG to have this component signed off by the client shortly after construction was completed.

With these drives completed to everyone’s satisfaction, the sewer upgrade is on track for completion in June 2014.
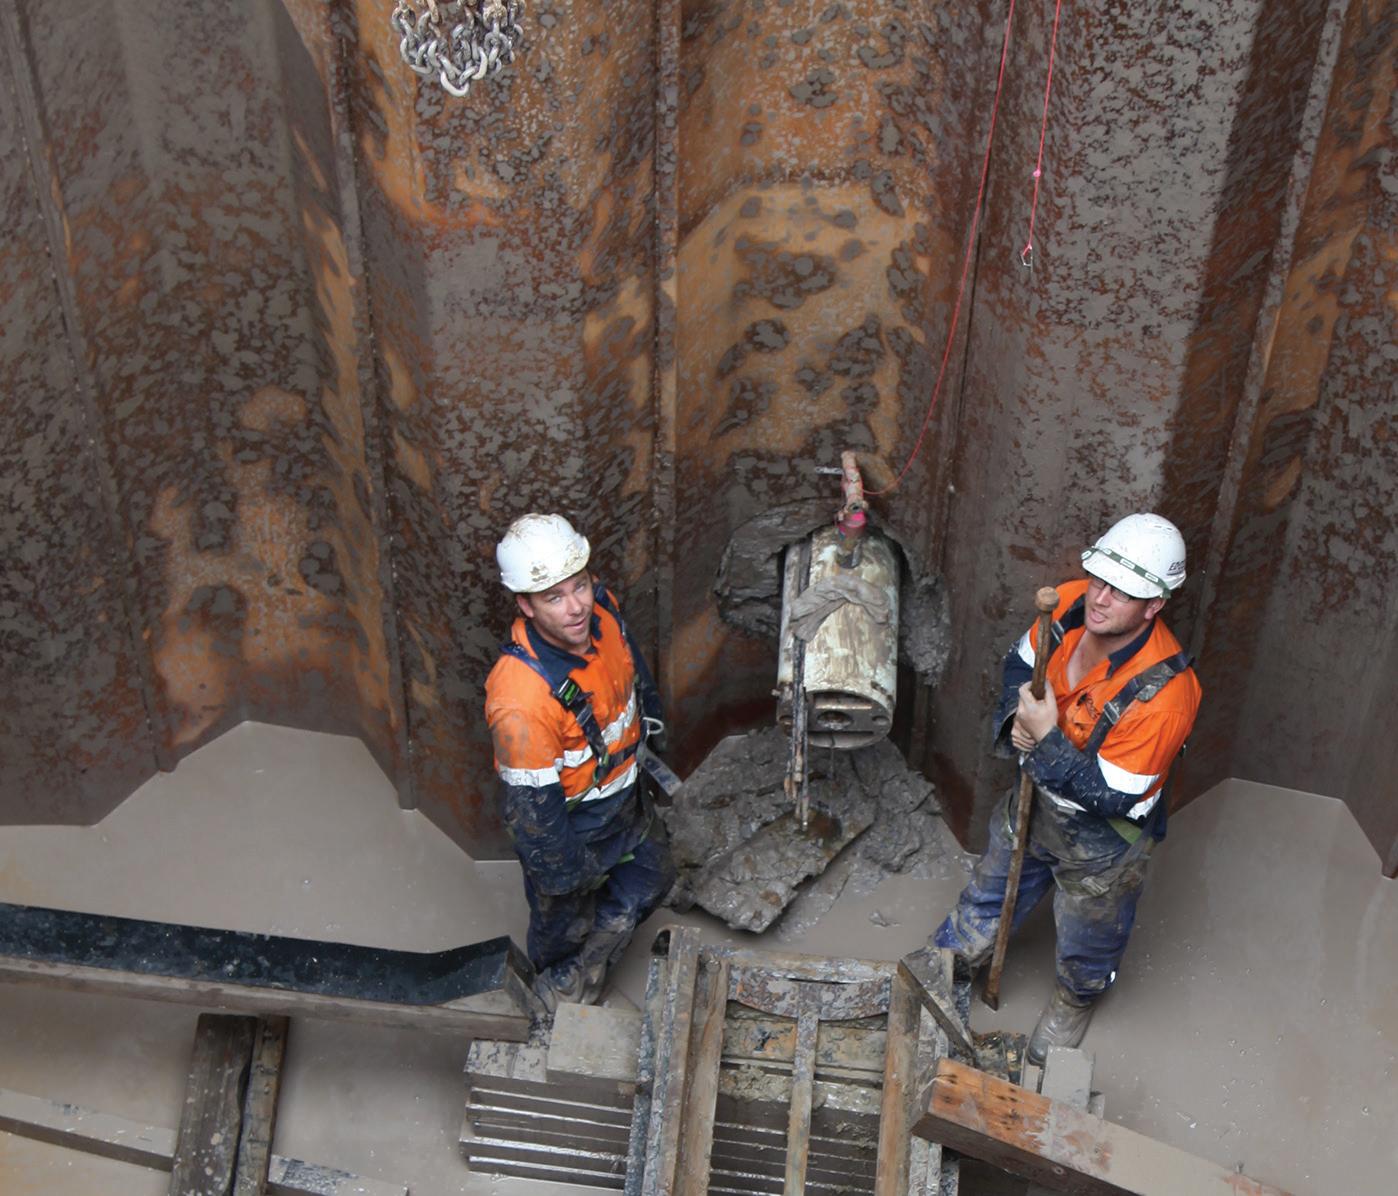
ABOUT US
Edge Underground is a precision microtunnelling contractor that operates in Australia and the USA. With a focus on innovative technology and expertise, Edge Underground designs and enhances the performance of trenchless equipment.
WWW.UTILITYMAGAZINE.COM.AU
SERVICES
OUR
• Microtunnelling
• Pipe Jacking
• Thrust Boring
GUIDED BORING SPECIALISTS ( 0458 000 009
stuart@edgeunderground.co 8 www.edgeunderground.co Find out more about keyhole pipeline installation www.keyholepipeline.com.au
• Laser Tunnel Boring
*

CABLE TUNNELS UNDER SYDNEY
Ausgrid recently celebrated an early milestone on its City East Cable Tunnel (CECT) project in Sydney’s CBD.
The CECT tunnel is a critical component in Ausgrid’s project to future-proof Sydney’s electricity supply network.
After having launched the tunnel boring machine (TBM) at the Riley Street (Surry Hills) Substation in January last year, Thiess’ CECT project team achieved breakthrough at the City North Substation on 29 October 2013, 40 calendar days ahead of schedule.
At the time, Thiess project manager Tim Burns said the TBM excavation performance gave the project a good chance of finishing well ahead of its May 2015 completion target.
“This breakthrough is a huge moment, the culmination of four years of work.”
Mr Burns said the team had set up on-site 23 months prior, and had been excavating for 10 of those months.
BACKGROUND
Ausgrid awarded Thiess the $141
million contract after its successful completion of Ausgrid’s City West Cable Tunnel in 2010. The project began in December 2011.
The CECT project involves the construction of a 3.2-kilometre, segmentally lined tunnel – with an internal diameter of 3.5 metres – beneath the CBD to carry 132-kilovolt cables.
The tunnel connects the City North Substation in Sussex Street to the new Riley Street Substation.
The project also includes the construction of two concrete-lined connectors, an extension to the City South Cable Tunnel, and installation and commissioning of all tunnel mechanical and electrical services.
For the excavation and lining of the cable, Thiess had to obtain a bespoke TBM. “Much of the equipment came from overseas,” Mr Burns said.
He said it was “a logistical exercise” to get all the equipment on-site and working in the required safe and
productive manner.
Thiess also constructed a high-flow water cooler to recycle water used in the TBM’s cooling system, which managed to save an average of 26 megalitres per month.
Groundwater has been treated for reuse in the grout batching operations, reducing the need to use potable water.
TUNNELLING SUCCESS
Tunnelling underneath the vast and complex foundations and services of an established city demanded specific expertise.
On any shift, approximately 20 people were directly involved in the tunnelling operation, with nine people deployed on the machine and the balance engaged in tunnel logistics and maintenance.
Thiess emphasised safety as the number-one priority on the project. This was recognised when the CECT project
UTILITY • MAY 2014 WWW.UTILITYMAGAZINE.COM.AU 50
MICRO- TUNNELING

won the Site Safety – Civil Construction award at the 2013 NSW Master Builders Association Excellence in Construction Awards.
The judges said that the project team had invested time and resources to significantly reduce risks for tunnel workers.
The construction of such a major project in a dense urban setting, with many residents nearby, presented specific challenges and required a solid understanding of how to work with the community and the environment.
Mr Burns said that with such a project, “You need to have good community and environmental support, which we’ve been blessed with from the Thiess side and the client side.”
TOWARDS COMPLETION
Once civil works are complete, the final stage of the project involves the mechanical and electrical fit-out of the tunnel.

Completion of the CECT will complete Ausgrid’s ‘ring main’ for the Sydney CBD, linking the City South Cable Tunnel and the City West Cable Tunnel.
Mr Burns said that the Thiess team
has had an “excellent relationship with our client Ausgrid … based on open communication and trust. We’ve done a good job, and Ausgrid has supported us the whole way.”
WWW.UTILITYMAGAZINE.COM.AU UTILITY • MAY 2014
51 MICRO- TUNNELING
PILLIGA UPDATE: THE NARRABRI GAS PROJECT
By Peter Mitchley, Santos General Manager Energy NSW
Santos is a proud Australian company that has been exploring for and producing natural gas for over 50 years, and has been supplying gas to NSW for close to 40 years from its Moomba fields in South Australia. The proposed Narrabri Gas Project, located in the north-west of the State, will be the company’s first large-scale project in NSW.
Natural gas is an important source of energy for Australian households and businesses. The Narrabri Gas Project has the potential to supply up to half of the State’s natural gas needs as early as 2017, delivering gas to the NSW market when households and manufacturers need it most.
Without gas infrastructure development, businesses across the State, including large industrial customers, could face difficult decisions about their ongoing viability in the face of high gas prices or limited supply. Households would also likely feel the impact of rising gas prices.
Therefore, the NSW Government has recognised the strategic importance of the Narrabri Gas Project to the State’s energy needs, initiating a Memorandum of Understanding with Santos that commits to a timely assessment of the Project.
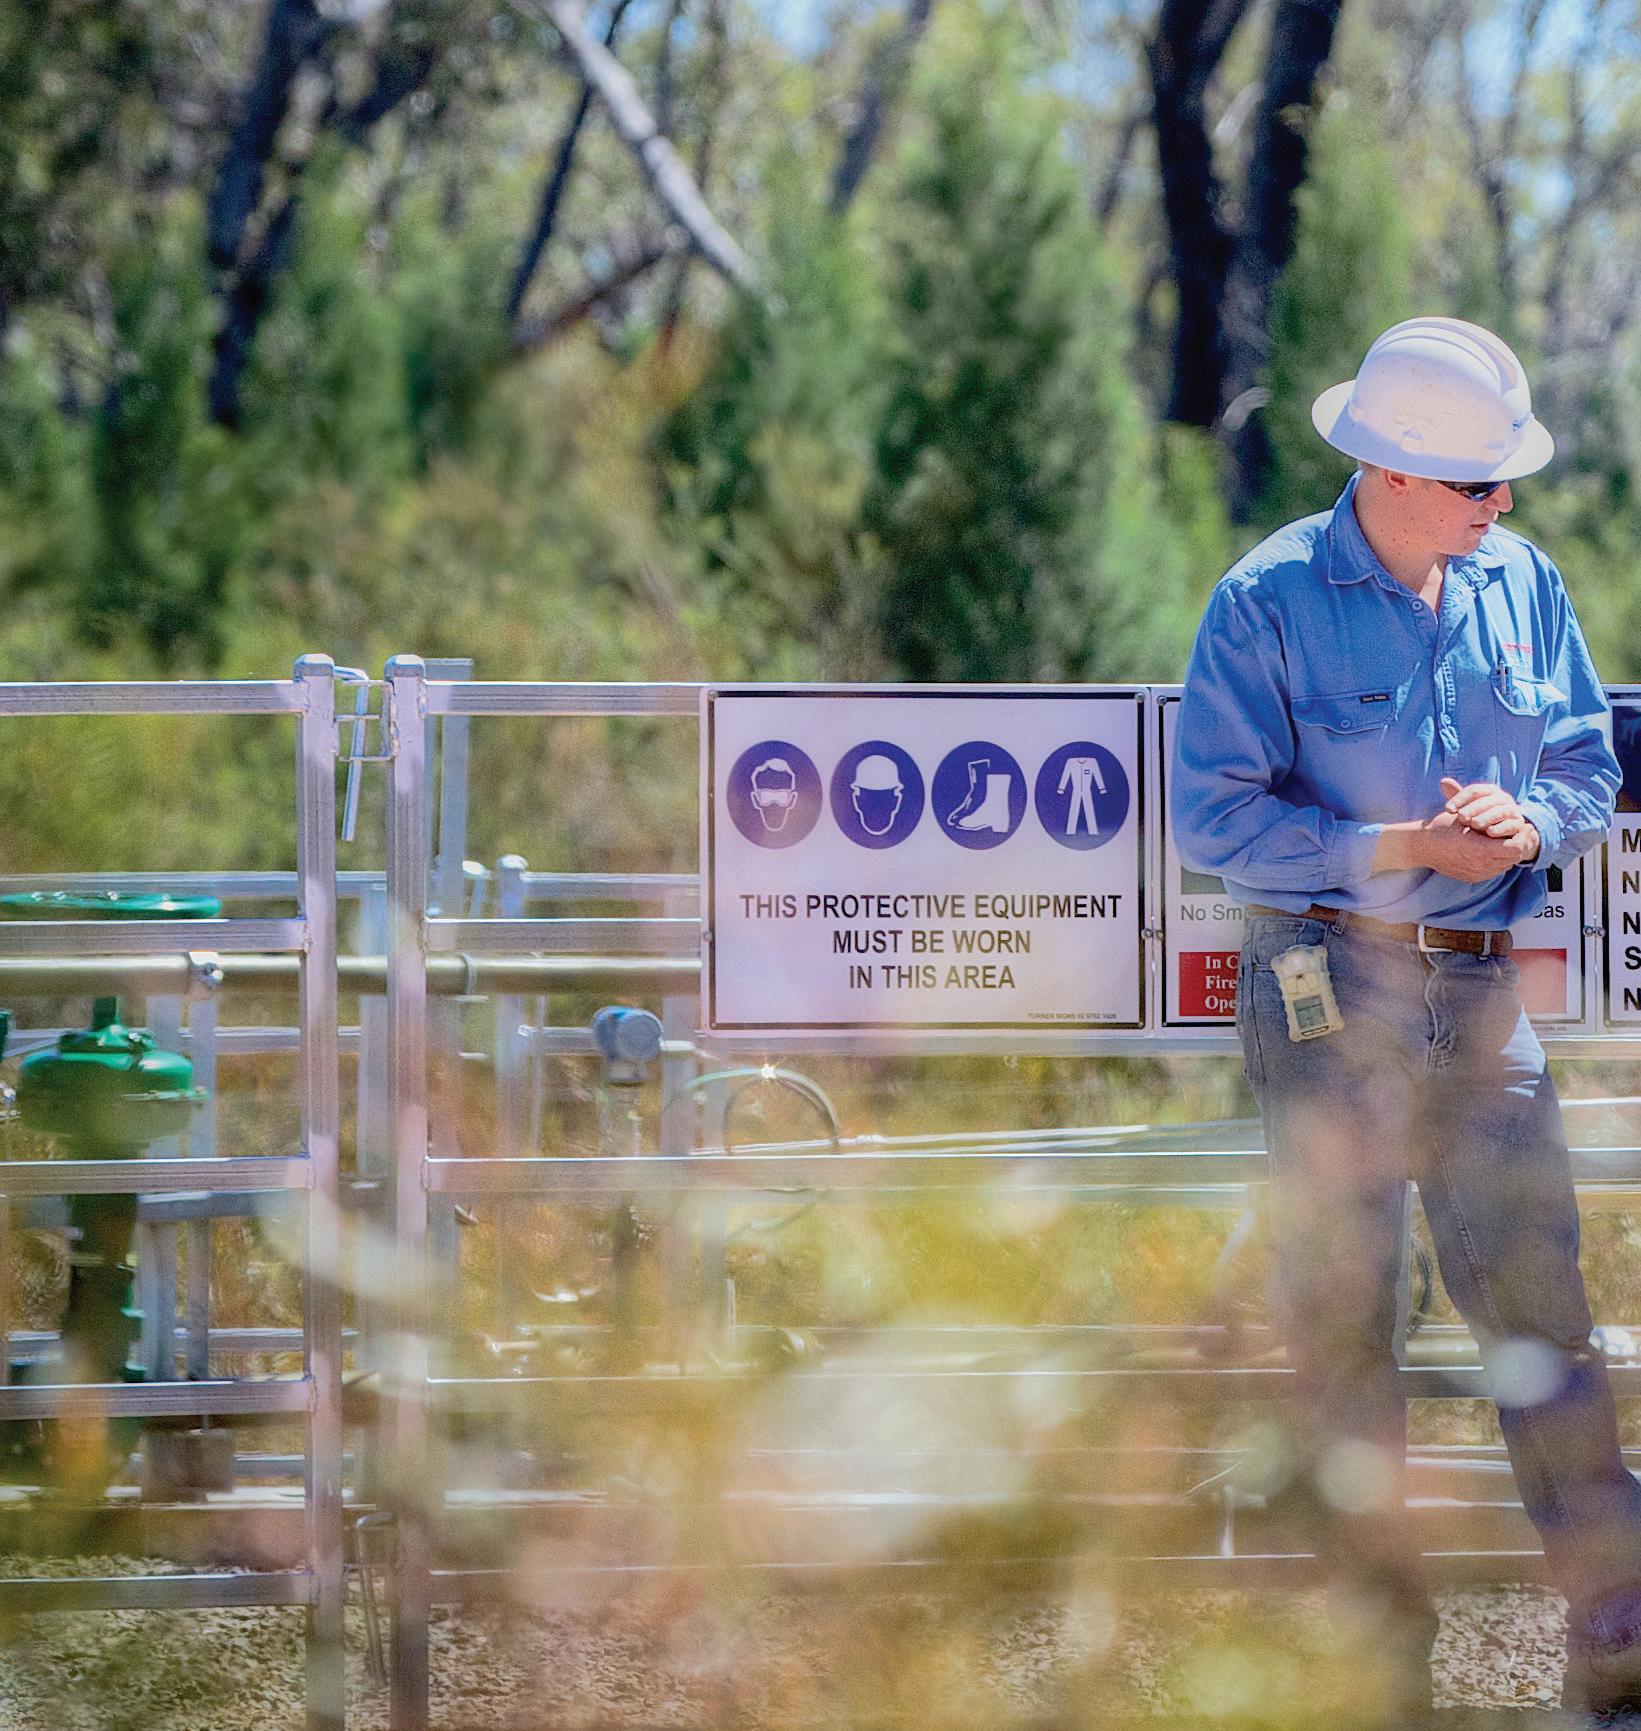
This landmark agreement stresses the importance of developing a sustainable natural gas industry to underpin and grow the State’s economic competitiveness.
The MOU does not guarantee a certain outcome from the assessment process. The Narrabri Gas Project will still be subject to the full stringent regulatory controls in place and Santos will continue to work within existing statutory timeframes.
The Narrabri Gas Project represents a significant economic opportunity for regional NSW. The Project will deliver much-needed investment and employment opportunities, including: 1,200 jobs during Project construction; up to 200 ongoing positions; and $160 million via a Regional Community Benefit Fund for local infrastructure and services in consultation with the local community.
The Project will also involve the
construction of a pipeline running south from the Narrabri area to deliver the gas to the NSW market.
Santos has a vested interest in protecting the region’s valuable agricultural land and water resources, and we have made substantial commitments to environmental protection and the safety of our operations. We know that we can only gain community trust by being open about our plans, operating responsibly and with minimal environmental impact.
Santos’ long-term plans involve the drilling of 850 wells in and around the Pilliga, south of Narrabri. Although the Project area covers around 98,000 hectares, field operations will take up less than one per cent of that area, about 900 hectares.
Horizontal drilling will be used to reduce the Project’s footprint and restrict the number of well-pad sites to 425.
UTILITY • MAY 2014 WWW.UTILITYMAGAZINE.COM.AU 52
COAL SEAM GAS

As wells are drilled, other wells will be decommissioned and the sites rehabilitated to minimise potential disturbance to landholders and the landscape. This process will continue over the 20-25 year life of the Project.
Our activities located in the Pilliga will be restricted to those areas reserved by the NSW Government for logging, gas development and other commercial activities. Drilling on private land will only occur where we have the voluntary consent of the landholder.
Currently Santos is carrying out a limited exploration and appraisal program of 16 wells in the Pilliga, in addition to flora and fauna studies, water monitoring, air measurements and social impact studies.
This work will enable us to finalise our plans, submit our Environmental Impact Statement to the NSW
Government and provide a solid foundation against which to measure our performance over the coming years.
Work is also underway on the Leewood Water Treatment Facility, located outside the Pilliga, which will handle water extracted during operations. Once the water is brought to the surface, it will be transported via an underground flow line to the Leewood Facility where it will be stored and treated for reuse.
A central gas processing unit will treat and compress the natural gas to Australian pipeline requirements, readying it for transport to market.
The Narrabri Gas Project represents an opportunity to deliver a cleaner form of energy in a safe manner, to put downward pressure on rising energy costs in NSW, to provide a separate income stream for landholders hosting
 PETER MITCHLEY, SANTOS GENERAL MANAGER ENERGY NSW
our development, to generate local ongoing jobs and to provide significant community benefits.
The assessment process and the requisite community consultation will take place over the next 12 months, and Santos will continue to work with the community in an open and transparent way to ensure a better understanding of the Project and to address community concerns.
WWW.UTILITYMAGAZINE.COM.AU UTILITY • MAY 2014 53
COAL SEAM GAS

54 UTILITY • MAY 2014 WWW.UTILITYMAGAZINE.COM.AU NBN
By Michelle Goldsmith

HOW FTTB TECHNOLOGY COULD CHANGE THE FACE OF THE NBN
The NBN rollout, currently Australia’s largest and most ambitious infrastructure project, brings with it an array of different challenges and opportunities. Since the change of government and subsequent revised NBN rollout plan, these include the testing of alternative connection technologies, such as fibre-to-the-building (FTTB) and fibre-to-the-node (FTTN), and the possibility of infrastructure based competition between NBN Co. and other telecommunications providers. We ask what this means for both utilities and consumers.
WHAT IS FTTB?
A fibre-to-the-basement build, alternatively known as fibre-to-the-building or fibre-to-the-business, involves the fibre-optic cables extending to the boundary of a building, such as the basement in a large multistorey building. The final connection to individual premises (e.g. each unit in an apartment building) is completed via non-optical means, such as coaxial cable, wireless or twisted pairs. In most cases, the closer the fibre-optic cable comes to the premises, the faster the possible broadband speeds. Therefore, this type of connection may enable greater upload and download speeds to customers than a fibre-to-the-node connection. Preliminary tests produced download speeds of 108Mbps and upload speeds of 48Mbps.
55 WWW.UTILITYMAGAZINE.COM.AU UTILITY • MAY 2014
NBN
The race to the basement – how FTTB technology could change the face of the NBN
This type of build is primarily used for large buildings in high density areas, and offers telecommunications providers the means to offer flexible product options to customers, and deploy new products and upgrades relatively easily.
THE FIBRE-TO-THE-BUILDING PILOT BUILD
The fibre-to-the-building pilot will test the rollout of high speed VDSL broadband to end users in ten apartment complexes and office blocks in Carlton, Brunswick and Parkville in Melbourne. Fibre-optic cables will be delivered to a connection box (or node) located in the communications rooms of the buildings. The box, in turn, will connect to the existing in-building wiring, enabling retail service providers to deliver broadband to each individual premises.
Telstra, iiNet, M2 and Optus have signed up to participate in the pilot, which is expected to run for three months.
During this period, NBN Co. and its telco partners will evaluate all aspects of the construction, installation, operation, service performance and overall customer experience.
NBN Co has already installed VDSL2 vectoring equipment, which enables the delivery of high-speed broadband services over each building’s existing telephone cabling, in eight high rises – including a mix of apartments, and retail and office buildings.
The Government’s Strategic Review of the NBN suggested that up to 12,000 buildings, containing around one million individual premises, could be connected by FTTB.
THE FIBRE-TO-THE-NODE PILOT BUILD
The fibre-to-the-node pilot will take place in two locations: Umina near Woy Woy on the NSW Central Coast and Epping in Melbourne’s northern suburbs. It will involve the construction of two small scale copper serving area modules and kerbside node cabinets, which will connect the NBN fibre to spare copper pairs in the Telstra pillar.
Once active, NBN Co. will invite retail service providers to participate

in a limited fibre-to-the-node end user trial, which will test the delivery of high speed broadband via FTTN to up to 100 premises at each location.
NBN Co. is negotiating a collaborative agreement with Telstra to gain access to its copper access network for the purpose of the trials. This agreement will fall outside the terms of the Definitive Agreements between the two companies.
INFRASTRUCTURE COMPETITION – AN NBN POSSIBILITY
Recently, the possibility of other network providers rolling out their own fast broadband networks in direct competition with the NBN has gained traction.
In September last year, TPG announced plans to connect approximately 500,000 apartment blocks and office buildings in highly profitable urban areas to an FTTB network.
As this plan technically counts as extending existing infrastructure within distance limits set by the former government’s NBN regulations, it does not breach the current legislation to prevent infrastructure based competition between the NBN and other network providers.
In March, Telstra responded by revealing that it too had been testing FTTB technology, which it intends to use to build its own rival network, unless the Government changes regulations to prevent infrastructure competition. If these plans go forward they would mean that NBN Co. would face competition for customers in some potentially highly profitable areas.
While NBN Co. Executive Chairman
Ziggy Switkowski has stated that allowing such competition may damage the profitability of NBN Co., other stakeholders suggest that competition may offer various benefits to customers and the telecommunications industry as a whole.
A final decision on whether infrastructure competition will be permitted is expected to be made once a panel of experts, appointed in December 2013 to conduct a cost-benefit analysis and review of regulation on the NBN, submits a final report in June.
This panel of experts is made up of Dr Michael Vertigan AC as Chair, and Ms Alison Deans, Professor Henry Ergas and Mr Tony Shaw PSM. The panel will investigate and make recommendations on NBN regulation and policy, including the role of government support for fast broadband, industry structure and competition, and other longer-term industry matters.
THE PROS AND CONS OF INFRASTRUCTURE COMPETITION
Many telecommunications providers and other stakeholders have made submissions to the panel, putting forward their own suggestions regarding how the NBN should be structured and regulated. The possibility of infrastructure competition featured heavily in a number of these submissions, including those by TPG, Telstra, iiNet and the Australian Competition and Consumer Commission (ACCC).
Meanwhile, Mr Switkowski recently voiced concerns at a Senate hearing that if too many members of the public choose to use these alternative networks instead of the NBN, NBN Co.’s
UTILITY • MAY 2014 WWW.UTILITYMAGAZINE.COM.AU
56
NBN

profitability may be reduced.
However, in its submission to the panel, TPG presented a case for allowing infrastructure based competition to go ahead. The company argues that the NBN “was never meant to be a fixed line monopoly” and that “infrastructure based competition delivers the best outcome to end users”.
The submission states that carriers (other than Telstra) invested many hundreds of millions of dollars building superfast networks prior to 2011 and should remain permitted to make use of those networks to compete with the NBN and other broadband providers.
This suggestion has gained broad support from iiNet, who also suggested a number of conditions to level the playing field for all telcos, including the provision that any competitor to NBN Co. also provides access to their fibre networks on a similar basis.
The ACCC submission stated that: “Generally speaking, the ACCC considers that, where it is economically efficient, infrastructure-based competition is likely to promote the long term interests of end users. Where efficient network duplication can occur, competition between networks can drive dynamic efficiencies in terms of product differentiation, innovation and timely investment. Telecommunications is a complex and highly dynamic industry, and therefore there may be benefits to be gained from encouraging network-level competition and innovation. The ACCC considers that non-NBN Co. network operators should generally not be constrained from deploying networks in competition with NBN Co, including in new developments, unless
there are particular circumstances which suggest it would not be in the interests of end-users.”
Critics of allowing infrastructure competition warn that steps must be taken to avoid network providers ‘cherry-picking’ profitable areas for their own networks, as the profits generated by customers in such areas are required by NBN Co. to compensate for rolling out the network in more regional areas, which cost more to connect.
In order to address this, the ACCC suggested changes to NBN subsidy policy to better allow NBN Co. to compete, and to prevent consumers in less profitable areas from losing out.
“Where NBN Co. faces competition, its ability to compete on price may be constrained by broader objectives and/ or regulation. In particular, NBN Co.’s pricing response may be constrained by a requirement to internally cross-subsidise non-commercial regions or a degree of national pricing parity. This is because under certain scenarios, infrastructure-based competition could lead to price competition only in certain geographic areas (e.g. low cost areas). Under a cross-subsidy policy, these low cost areas could have been expected to provide the revenues used to fund the cost of servicing high-cost areas. Price competition will potentially erode the funding base that may be available to support a policy of internal cross-subsidies. The ACCC considers that explicit subsidies to non-commercial areas are preferable and more transparent than internal cross-subsidies. This approach could address the dual questions of NBN Co. being better positioned to respond to competitive pressure arising
from infrastructure-based competition and the broader social objective of promoting the interests of consumers in non-commercial areas, according to the ACCC.”
Telstra also addressed the issue of infrastructure based competition in its submission to the panel. Among a number of suggestions for improvements for a more effective and efficient network rollout, Telstra stressed that if infrastructure based competition with the NBN is allowed, steps must be taken to provide a level playing field for telecommunications providers to compete on.
“The extent to which facilities-based competition to the NBN is permitted is a policy decision for Government. Telstra’s position is that if facilities-based competition is permitted, there must be a level playing field between all alternative builders, whether under regulatory restrictions like the superfast broadband rules or under contractual commitments to NBN Co.,“ Telstra said.
As the panel’s report draws nearer and telcos trial or commence their rival network extensions, it looks ever more likely that FTTB will play an important role in Australia’s fast broadband network. The possibility of infrastructure competition also opens up a range of exciting possibilities for those involved in the telecommunications industry, and if it is permitted we may see a spate of new products and infrastructure projects in the sphere. The eventual face of the NBN may still be shrouded in mystery, but hopefully the release of the panel’s report will bring us a step closer to finding out.
WWW.UTILITYMAGAZINE.COM.AU UTILITY • MAY 2014
57
The race to the basement – how FTTB technology could change the face of the NBN
NBN

UTILITY • MAY 2014 WWW.UTILITYMAGAZINE.COM.AU 58 NBN
By Anthony Emmerson, Operations Manager – Infrastructure, Taylors

The Taylors NBN journey started in July 2010. The NBN project was in its infancy. A trial rollout had begun in Tasmania and the project was gaining some media coverage, however the coverage was largely political and few in the mainstream business community had started to turn their heads in the NBN direction. In fact, in the wake of the GFC many businesses were still picking themselves up and dusting themselves off, particularly businesses heavily exposed to the development industry, including most surveying firms. Though inexperienced in the space, strategically we were well positioned given that two years earlier we had established an infrastructure team to target large projects such as this.
When we began our investigations into the NBN project we knew we had a long road ahead of us. The majority of our previous work had been in the property industry and we had very little experience in the surveying of electrical infrastructure. So in order to learn more, we immersed ourselves in the space. We attended every NBN seminar and information session we could find, spoke to businesses and people in the telecommunications industry and read every publication we could get our hands on. Pretty soon, two things became clear. Firstly, that the NBN was an immense undertaking and that the size, scale and speed in which it would be built marked it as a once-in-a-generation project, the likes of which we had never seen. Secondly, that the current survey practices and resources in the electrical infrastructure construction industry would not be sufficient for the needs of this project.
We turned our investigations to finding a suitable survey methodology that would be fit for purpose to the NBN project. With NBN Co. planning to rollout to 3.5 million premises
WWW.UTILITYMAGAZINE.COM.AU UTILITY • MAY 2014 59 NBN
Surveying the broadband superhighway at road speeds
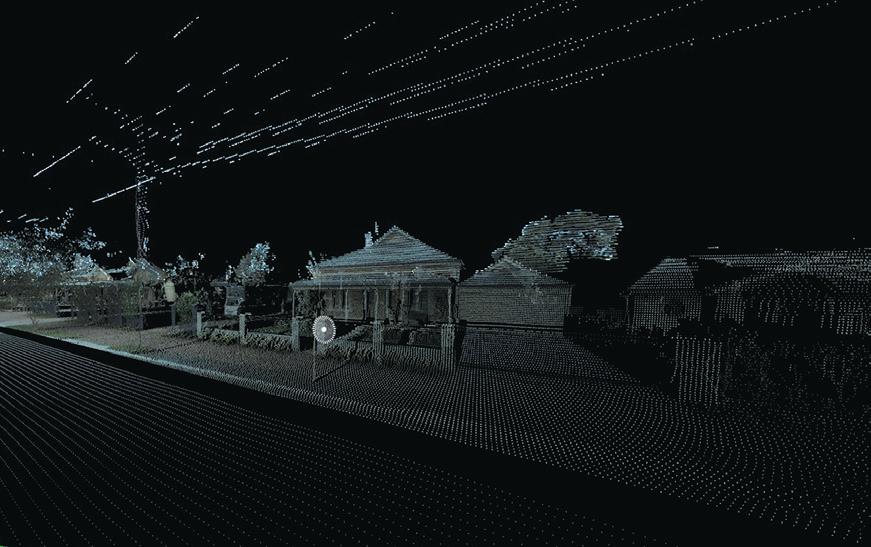
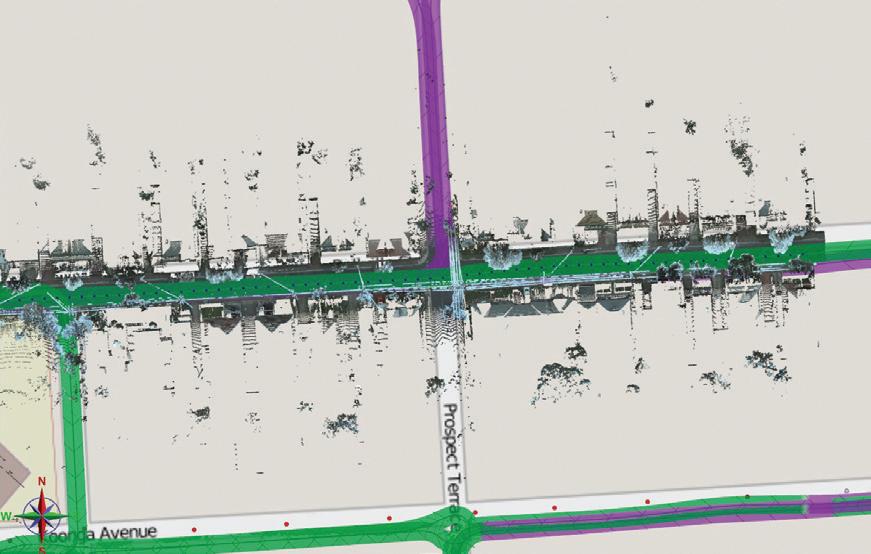
by 2015 and full completion by 2020, we knew that traditional surveying methods would not keep up and that the existing resources in the electrical infrastructure surveying industry would not meet the demand. We considered a number of existing technologies and ruled out the approaches that would not meet the requirement. For instance, traditional total station work would be appropriate for small sections of cabling but too slow for the mass survey of entire suburbs. Measuring wheels and extendable poles would be too inaccurate to produce the reliable results required for major project design works. Fixed wing Aerial LIDAR was a great tool for collecting masses of data quickly and indeed it was commonly used for the larger electrical transmission lines, but it was considered too inaccurate for the smaller electricity distribution networks
that run through suburban streets. Our research soon led us to a relatively new technology called vehicle mounted LIDAR or mobile mapping.
LIDAR uses ultraviolet, visible, or near infrared light to image objects and can be used for a wide range of targets. Accurate vehicle positions are obtained using three redundant technologies: a dual frequency GNSS receiver establishes a geospatial position; an Inertial Measurement Unit (IMU) tracks vehicle position; and connection to the vehicle CAN bus or external wheel encoders obtains odometry information. These three technologies work together to sustain a highly accurate 3D position for the vehicle even in locations where satellite signals
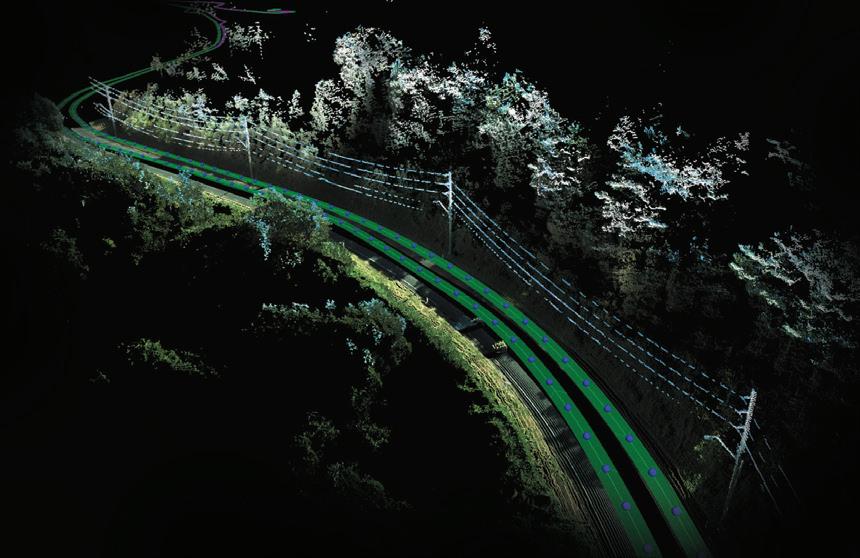

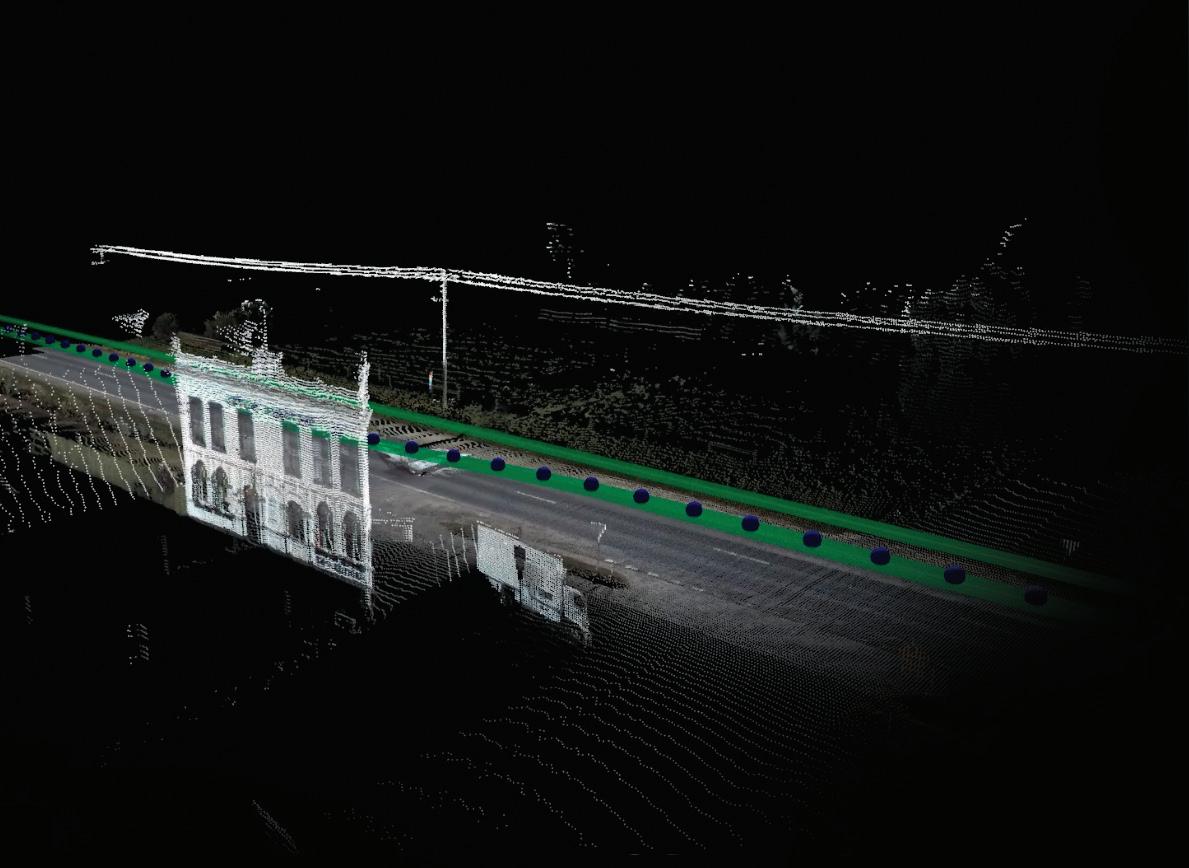
UTILITY • MAY 2014 WWW.UTILITYMAGAZINE.COM.AU 60
NBN
can be blocked by obstructions such as buildings, bridges, or tree lines. Vehicle LIDAR can provide extremely fast survey results for large-scale projects. A further important aspect of the system is its ability to capture high resolution 360 degree imagery. The system logs imagery at user nominated intervals to create georeferenced images or video logs. This element further enhances the design engineer’s ability to review field conditions and clarify issues from their desktop without attending the physical site. The vehicle is able to travel at speeds of up to 80km per hour and therefore masses of data can be collected in a short amount of time. Furthermore, the proximity of the vehicle to the power lines as it drives along the road mean that accuracies of +/- 50mm can be achieved. We were confident that a vehicle mounted LIDAR solution was a good fit for purpose solution to the NBN project. We were able to team up with Rapid Survey Solutions (RSS) to help put
Surveying the broadband superhighway at road speeds
this field survey solution in place.
With a field survey solution in place we began to map out the office tasks. One challenge unique to vehicle mounted LIDAR that we had to overcome was the large volume of data that would need to be managed. As well as storing, transporting and housing that data, we would also need the software, computing power and expertise to work with the data. So we invested in point cloud data software. Over a 12 month period we utilised vehicle mounted LIDAR to deliver surveys for a sizeable sewerage scheme in south eastern Victoria, a pipeline in Warrnambool and a recycled water project in Coburg. The site would be surveyed using mobile mapping and the data sent back to our head office, where our surveyors would extract the required survey data and produce the final survey model.
Soon after, we delivered our first batch of NBN data. Securing work on Australia’s biggest infrastructure project
in more than 80 years was both the end of one long journey and the start of another, and we continue to build our capability throughout the NBN project life cycle, which is expected to take over ten years to build. During that time we have upgraded our business systems, trained and developed our people to work in a new surveying frontier, improved our survey methodology and quality assurance procedures and developed a reputation both for ourselves and our client as a premium provider of NBN spatial data.
Taylors are very proud and excited to advise that our NBN Solution won the SIBA 2013 Victorian Spatial Excellence Award for Innovation and Commercialisation.
Visit www.taylorsds.com.au to find out more.


Environmental Consulting Solutions
Hydrographic Technology
Our Infrastructure team remain at the cutting edge of solutions driven technology with the use of remote sensing boat technology to deliver hydrographic mapping.

Aerial Survey Solutions
Unmanned Aerial Vehicle (UAV) Mapping
We complement our traditional surveying services with aerial surveying using UAVs, delivering orthorectified imagery and digital elevation models in all common CAD and GIS formats.
Cutting Edge Technology
Vehicle Mounted LIDAR
This solution overcomes the challenges of mapping linear features to a high level of accuracy and is being used with great success as part of our service delivery on the NBN project.
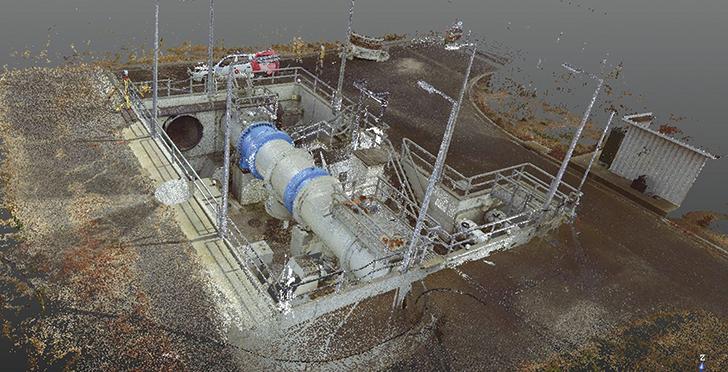
Rapid Response Services
Terrestrial Scanning
Terrestrial scanning is our preferred method of survey for projects requiring a high level of accuracy. We can assist you with extracting information, or simply provide the point cloud to you directly. Our team of over 40 surveyors means that we can be on site, to most places in Melbourne, within 24 hours.
Our rapid response survey units use the latest in GPS, robotic total station and digital leveling technology to deliver acurate and cost effective solutions for a broad range of projects and market sectors. Visit our website to find out more.
www.taylorsds.com.au
Infrastructure
WWW.UTILITYMAGAZINE.COM.AU UTILITY • MAY 2014 61
NBN
Relationships | Expertise | Solutions
HOW THE PAST IS CREATING THE FUTURE FOR SA WATER’S GIS PROJECT
Geographic information systems (GIS) have become integral to almost every aspect of the operations of public utilities around the world. As one of the first utilities in Australia to fully capture and store its entire network on a GIS, South Australia’s SA Water began their project almost 30 years ago. Today they have a sophisticated system that is continuously being updated, with views to expanding operations even further.
62 UTILITY • MAY 2014 WWW.UTILITYMAGAZINE.COM.AU MAPPING & GIS
In 1986, SA Water began capturing its statewide water and wastewater reticulation-network data. With 25 full time equivalent employees manually digitising the information from hard-copy reticulation plans, this mammoth information transfer took until 1992.
During the digitisation process, more than one million as-constructed drawings had to be scanned, and each had to be linked to the relevant GIS
feature. SA Water managed to create high-quality TIFF images by scanning microfilm copies of individual drawing books.
For the initial data capture, SA Water opted to use Data General hardware together with TEO/3D engineering database software. In 1994, however, the database was transferred to an ESRI system, and the utility currently uses the ArcGIS design and management-solution platform, ArcGIS Server
for data distribution online, ArcFM, and ArcSDE. SA Water’s internet GIS is known as ‘AquaMap’, and the Geocortex Silverlight web viewer provides user access to data.
One of the major engineering challenges was defining the GIS database schema to make sure it would answer business needs. SA Water undertook extensive internal workshops with its business representatives – such as asset managers, planners, network
63 WWW.UTILITYMAGAZINE.COM.AU UTILITY • MAY 2014 MAPPING & GIS
The evolution of GIS: How the past is creating the future for SA Water’s GIS project
operators, as well as those in customer service and finance – in order to: first ascertain those requirements the GIS needed to address; and then to define the database’s technical structure accordingly.
The utility also needed to ensure the GIS database schema enabled integration with other relevant corporate information systems and databases, such as their works management system (which uses Maximo 7), their Water Quality System, Property System, SharePoint and ‘Dial Before You Dig’. And so SA Water developed their own ‘loose integration’ model for Maximo to provide a broader range of compatibility.
Through the process, SA Water managed to create a GIS database schema that is now able to be recalibrated and adjusted to reflect current and changing business needs.
SA Water also developed a Data Quality Strategy and GIS Data Management Plan to ensure high-quality data.
The company came up against technology limitations relating to data
distribution, particularly in the period immediately following the completion of the data capture. They had to figure out how to broaden user access to data and make the GIS ubiquitous throughout the organisation.
At first microfilm was used for data distribution, but then a web browser was created in 1997 using ArcInfo. From 2002 they began using ESRI Australia’s Eview/ArcIMS web browser, until the Geocortex software was implemented late last year.
In order to overcome challenges posed by proprietary GIS databases, SA Water developed a longer-term strategy to use a more open and non-proprietary database environment for GIS data, moving from a proprietary ‘tile’ based GIS to a seamless, open SQL-compliant GIS database.
The need for long GIS transactions (or edit sessions) presented a new challenge. “Unlike traditional databases, where transactions are created/updated over very short timeframes, the capture of GIS transactions may take a longer
duration to complete, e.g. capture of pipe assets from proposal stage to official handover through to end of life decommissioning.” says an SA Water spokesperson.
SA Water uses a ‘check-in/check-out’ process for GIS transactions, which can last anywhere from a few minutes to several months. This process allows users to access and update the GIS remotely.
THE GIS TODAY
At the time SA Water created its GIS, there were very few examples to follow.
Through the process, SA Water realised,“ The GIS needs to be the corporate reticulation pipe asset register, and the point of truth for reticulation data statistics used for asset, financial and regulatory reporting.”
Today, the GIS is a powerful integrator of information, and this includes integration by location of customers, assets, events, land, water resources, other infrastructure, soil, rainfall and so on.
The GIS data is edited and
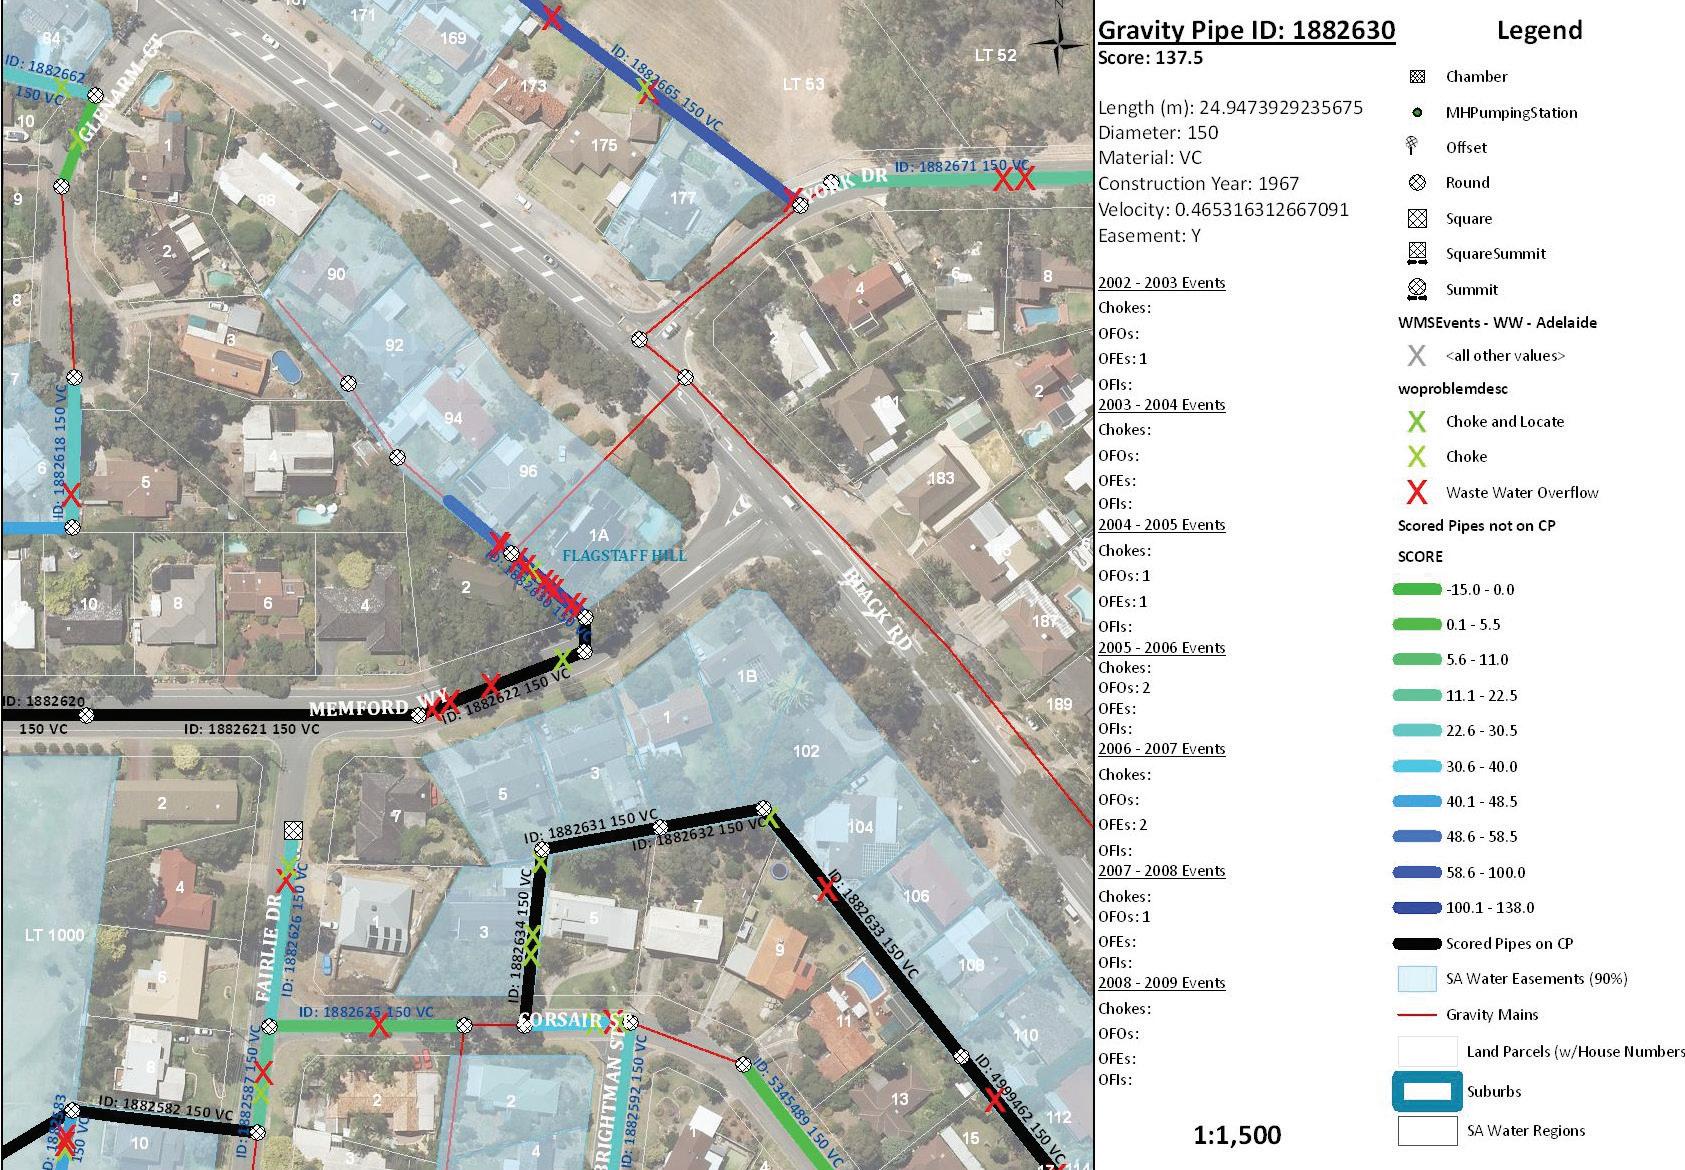
UTILITY • MAY 2014 WWW.UTILITYMAGAZINE.COM.AU 64 MAPPING & GIS
The evolution of GIS: How the past is creating the future for SA Water’s GIS project
maintained in an SDE (spatial database engine) Windows SQL Server database and is nightly transferred to the GIS Warehouse (Windows SQL Server) for user access.
A team of editors updates the GIS daily, and they use the ArcFM software extension, “which has been configured to ensure efficient and accurate data capture”, says the spokesperson. SA Water has developed a series of tight workflows and standards to ensure data for all new assets is transferred onto the GIS, such as data from capital projects, and gifted assets as a result of land development.
The GIS is used widely throughout the organisation to support a range of business processes, such as asset
management, systems planning, field operations (work management), customer service, and land development responses.
There are different levels of users, ranging from those working in specialised complex spatial analysis and editing, through to basic viewing and printing. AquaMap is used extensively and offers a broad range of functionality. Editors, asset managers and other high-end users use ArcGIS Desktop and an array of sophisticated software extensions to access, capture and analyse data.
AquaMap is available to all SA Water and Allwater staff – Allwater being SA Water’s contractor for metropolitan water and wastewater operations.

AquaMap is also provided under licence to external users, such as the SA Metropolitan Fire Brigade, consultants, property developers, surveyors and plumbers. SA Water also makes available raw GIS data under licence to any approved state or local government agency or private utility that requests it. Data is also provided to Dial Before You Dig.
LOOKING AHEAD
There are many initiatives currently being considered to further evolve SA Water’s GIS.
The creation of a GIS Services User Publishing area would allow the GIS functions of individuals to be shared and reused. It would also permit users to create GIS services – such as mains associated with the sewer cleaning program – that others could use and view in a flexible, managed manner.
SA Water is also contemplating the use of Private GIS Clouds, which could facilitate greater collaborative use of data with other systems.
The utility could soon implement GIS Mashups and customised GIS Views. This would be done by making use of SharePoint 2010 capabilities, and would allow domain experts to create new views and models, and to share the information more easily with other general users.
There is a possibility of using GIS information more broadly in reporting and business intelligence (BI) – such as integration with a BI/Enterprise Data Warehouse Platform.
SA Water is also looking into the use of Mobility solutions to extend the
WWW.UTILITYMAGAZINE.COM.AU UTILITY • MAY 2014 65
Whyalla Morgan
MAPPING & GIS
Port Augusta
The evolution of GIS: How the past is creating the future for SA Water’s GIS project
reach of GIS to staff and third-party alliance members. Among other things, this would facilitate the capture of water main bursts and leak locations using mobile GPS, and would facilitate viewing of relevant information based on geographical area, as well as attaching photos of assets to GIS entities. The utility is also considering linking physical assets to the corresponding virtual data, with the use of – for example – barcodes, QR codes, and mobile device cameras and barcode readers.
The company may extend GIS services to external customers to allow for pipe-burst reporting, as well to view water holdings and related customer-focused information.
SA Water is also looking at increasing the linkage between the GIS and customer information, such as performance of assets against properties, and increased precision in identifying customers affected by network outages. And the utility could increase the transactional nature of customer data flowing between CSIS and GIS systems through a more flexible integration approach and use of business rules and the BI platform.
Increased integration between GIS and the Customer Application Management System is also a possibility, so that new service point locations are captured and entered directly into GIS as part of the connections and extensions workflow process.
Under consideration too is the possible integration of GIS with SA Water’s Incident Management System, to facilitate the management of incidents such as wastewater overflows by being able to determine the geospatial impact downstream.
SA Water is also considering enhanced integration with external GIS data providers - such as the Department for Transport, Energy and Infrastructure, and the Department of Planning and Local Government - from where SA Water sources cadastre, topographic and planning data.
GIS tooling could be utilised to develop schematic views of the information contained within the GIS system, so that it is maintainable and reusable.
The integration between the GIS and
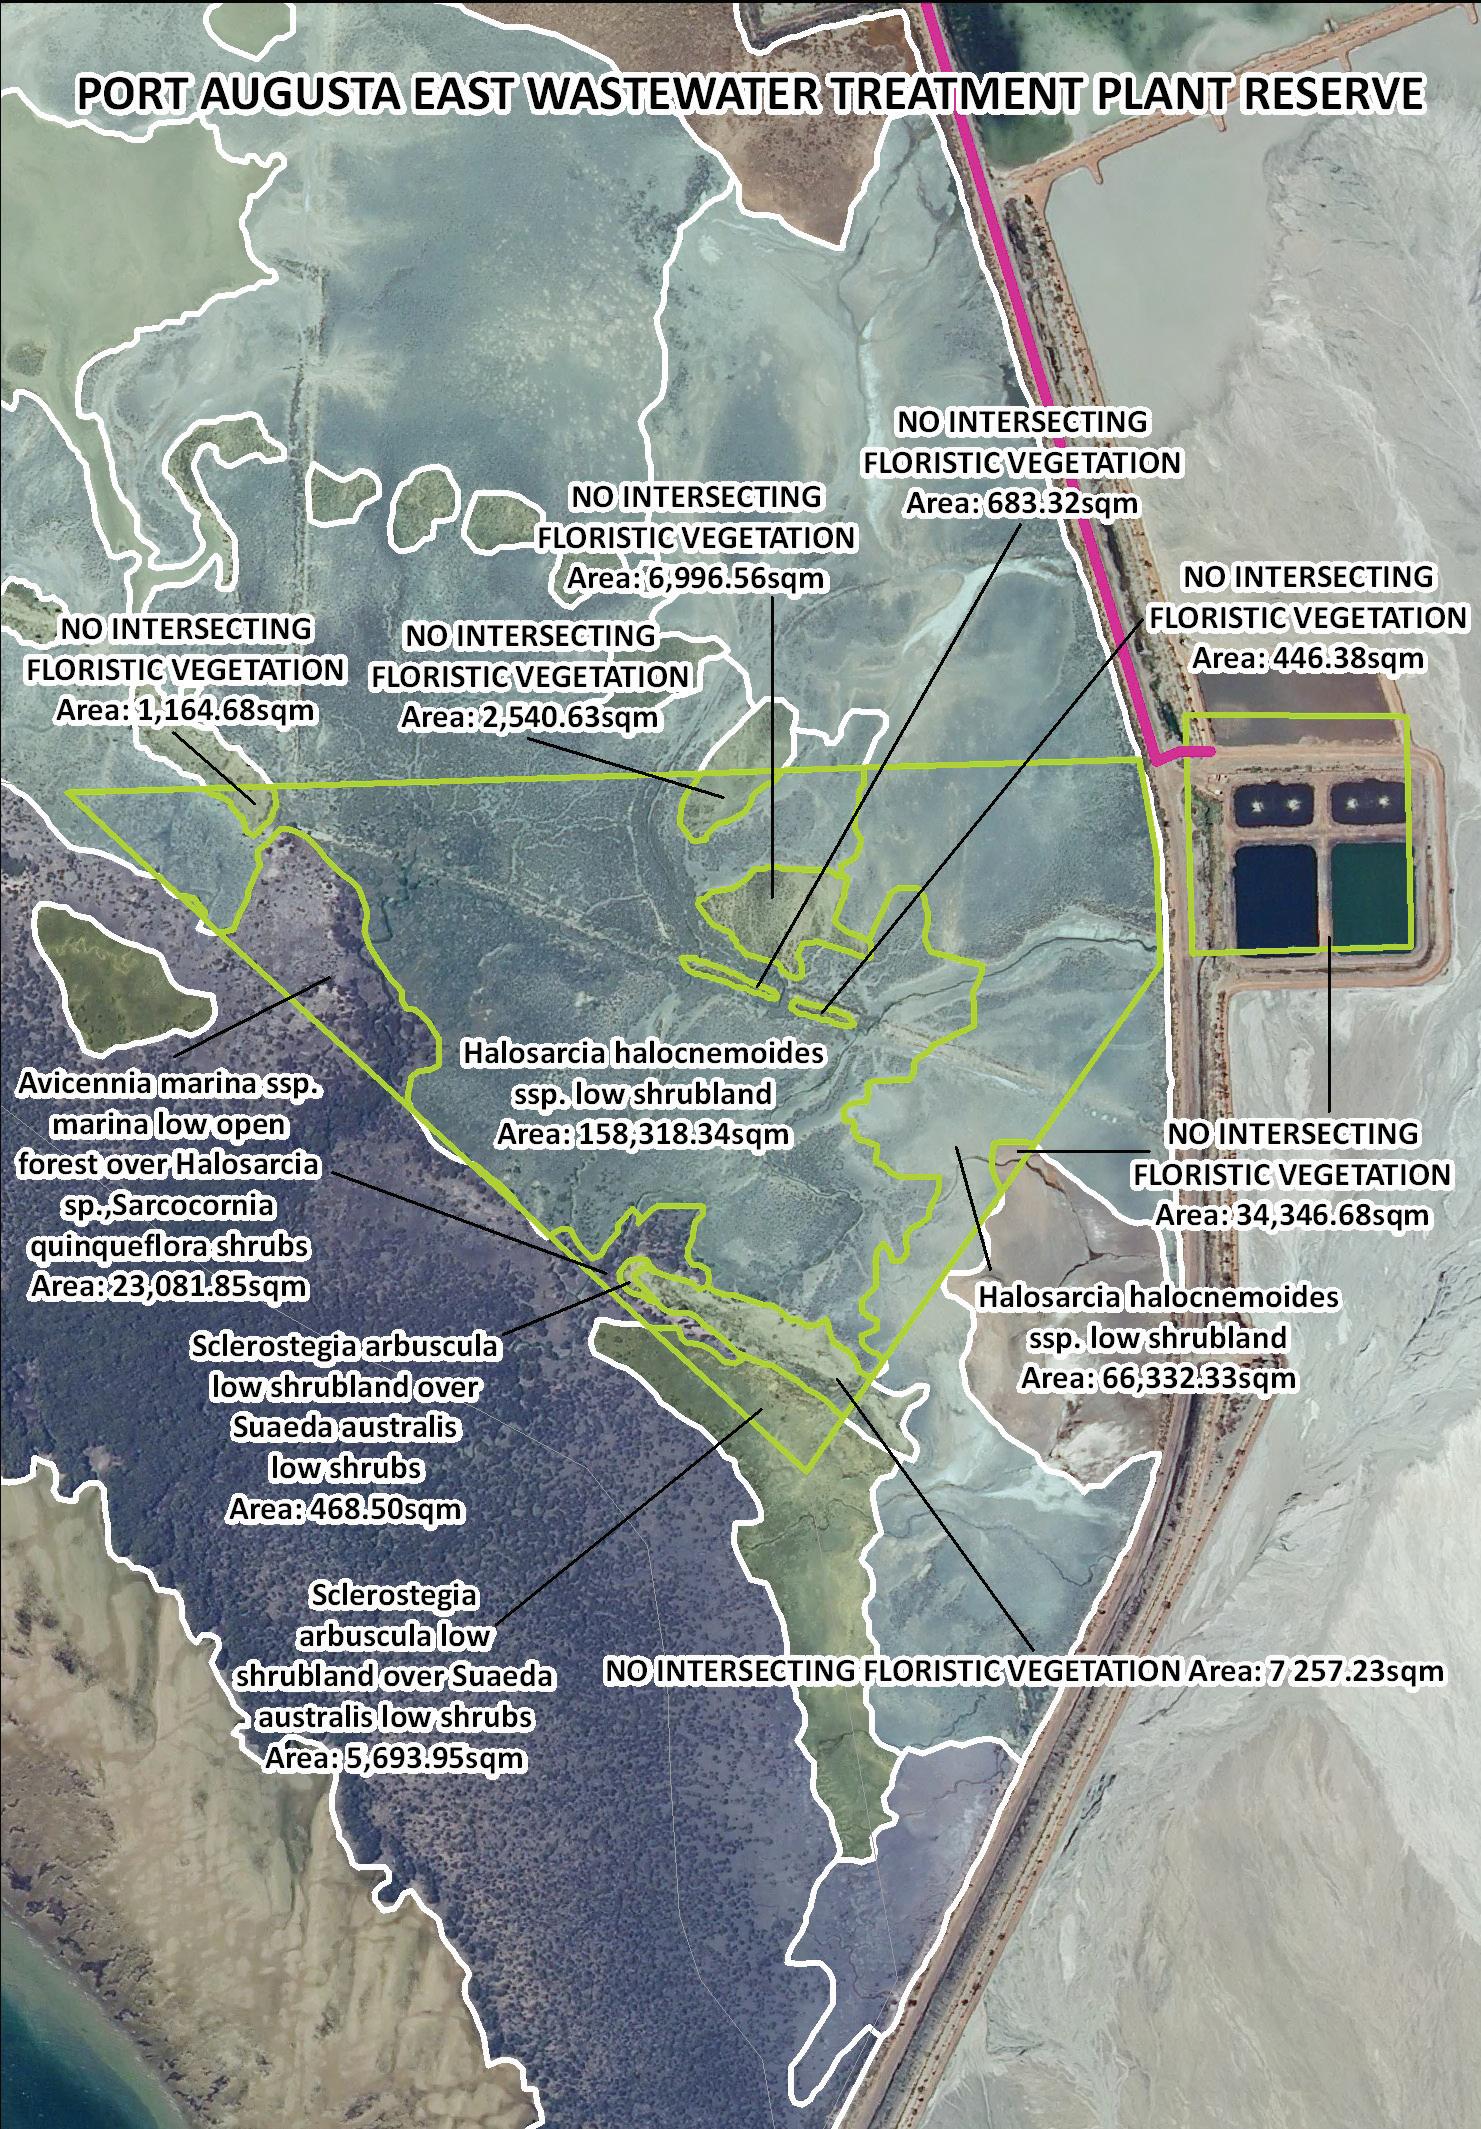
Hydraulic modelling software could be improved to enable the automated creation of models GIS Tracking would support the tracking of the company’s items, such as the operational vehicle fleet, and this could be facilitated by the creation of location-based alarms.
To heighten the precision of its information and output, SA Water might consider using 3D visualisation of new facilities, as well as line-of-sight spatial calculations. The use of satellite and airplane-generated imagery could provide more accurate and precise data for the inspection of above-ground pipelines, as well as being able to monitor sea grass growth in the vicinity of
treatment plant outlets and to identify floristic vegetation in the vicinity of reservoir reserves.
Access to video on demand that is geospatially referenced could also be a possibility.
And of course, GIS data quality and maintenance of data is a continuous process of improvement in order to maintain a system that is flexible and adjustable to both business and customer needs.
Utility magazine would like to thank SA Water’s Asset Data Quality Manager, John Maitland for his invaluable assistance in compiling this article.
UTILITY • MAY 2014 WWW.UTILITYMAGAZINE.COM.AU 66
MAPPING & GIS

ERP MOBILITY: ENABLING THE SPATIAL ENTERPRISE
By Emil Vulin, Principal Consultant at we-do-IT
In a digital age, mobile devices are becoming the primary point of contact between an individual (be it a customer, partner or employee) and an organisation. This is especially important for large organisations like utilities, where staff may work in a variety of locations in the field but must be able to communicate with head office and with each other. Spatial information is a key ingredient in providing vital locational context in such situations, both for a field user’s immediate needs and for the ongoing analysis that provides crucial insights that lead to better decision making. Therefore, utilities thinking ‘big’ about mobile have embarked on the strategic planning journey often referred to as ‘mobile first’ strategy.
Enabling mobile GIS is not ‘just’ a replacement for paper maps anymore; it is a logical extension to highly stream-lined business process scenarios with around 80 per cent of all corporate data having a spatial component.
Implementing an effective ‘mobile first’ strategy requires consideration of topics such as mobile device management, how to integrate mobile capabilities to back-end systems, how to protect against security risks and how to analyse the vast amounts of data that will be collected via mobile devices. For a utility organisation, integration of mobile solutions with core systems, such as GIS, ERP, CIS, OMS, DMS and SmartGrid, is fundamental to delivering real business benefits. Enabling increased access and use of spatial data throughout an organisation, especially to remote field crews, offers benefits both to the business and to the field
WWW.UTILITYMAGAZINE.COM.AU UTILITY • MAY 2014 67
MAPPING & GIS
ERP Mobility - enabling the spatial Enterprise
users, including:
• up-to-date enterprise data which is available to all crews and external contractors in a timely manner;
• elimination of paper records
• reduced data maintenance costs;
• continuous data quality improvement of corporate data stores;
• enabling quicker, more informed decisions;
• minimising office support for field personnel;
• minimising truck-roll;
• increased productivity of field personnel;
• fewer abandoned jobs;
• lower cost of service and repair work;
• better fulfillment of service level agreements and regulatory requirements;
• improved Safety and compliance with OH&S requirements such as Lone Worker.
MOBILITY REQUIREMENTS
An effective spatial mobile solution must meet an ever-evolving range of requirements as technology improves and enterprise mobility policy and governance matures. There are a number of key requirements used for benchmarking spatial mobility solutions in today’s market, many of which are discussed below.
COST OF OWNERSHIP
Utilities have long had a requirement to provide field operators with a device that is ruggedised to withstand the inevitable punishment of field based work. In the past, ruggedised laptops were purchased. These were not only heavy and cumbersome, but also came with a heavy price tag. Now organisations are able to ruggedise a lightweight and versatile ‘consumer grade’ tablet product for a fraction of that price. Aftermarket cases in the $50-100 price range offer MIL-SPEC rated protection against field work hazards such as drops, vibration, dust, dirt, wind and rain. The total cost of ownership for such a device has reduced dramatically, and tablets are becoming increasingly
popular with utilities and telcos for field use.
FLEXIBILITY
As it is not practical for field workers to carry around multiple devices, the mobile device used must be versatile enough to meet all the user’s needs.
Currently, mobile device space is seeing a rapid acceleration in iOS, Android and Windows 8 tablet uptake. Users want their devices to perform more functions and integrate with one another more easily. Organisations have the luxury of choice, and are often willing to apply a mix and match procurement model to apply the best solution for different applications. The Bring Your Own Device (BYOD) initiative is also gaining momentum. Many employees already carry around a capable device and are happy to use it for work purposes to promote further flexible work arrangements.
In the application space, given the flexible device requirements, customers are expecting support for all major device platforms. Application vendors who bring to market a product for a single platform only will be unable to meet the flexibility demanded by customers. Providing cloud hosting options is mandatory, however on-site hosting is still required by many utility companies due to security concerns.
SIMPLICITY
Utility field crews demand technology which is simple, effective and unbreakable. Designing for simplicity is the key, whilst enhancing the user’s experience by making the most of today’s easy-to-use touch clients, native device features and other apps from the ecosystem. Many leading vendors now provide native mobile applications for ERP, CRM and Collaboration, redesigned for the mobile experience. With a utility company’s target usage profile of hundreds to thousands of users, easy-to-use and effective apps lead to maximised efficiency and reduced ongoing training costs.
AVAILABILITY
Utility field crews often operate outside of reliable cellular network
coverage areas, and this quickly becomes a barrier to mobility solutions that operate only in ‘online’ mode. Therefore, utilities require solutions that can operate in ‘sometimes connected’ mode. This means that the app operates primarily in offline mode, thereby being 100 per cent available, and connects online only when required and when in network coverage range to send and receive updates to and from a control centre. An additional benefit is a reduction in cellular network traffic, particularly for spatial applications, which can equate to real cost savings for an organisation’s mobile communications plan.
INTEGRATED INFORMATION
Improving the productivity and quality of field staff operations, and in turn their customer responsiveness, requires them to be equipped with the right information at the right time, wherever they are. This information is often different for each task and is nearly always a combination of information from numerous corporate systems. For spatial data, it can be a combination of internal vs externally sourced data, static vs volatile feeds, differing vendor formats, and offline vs online accessibility. Additionally, the user’s context may be relevant, for which information from a mobile device’s sensors, such as GPS location, can be used to focus information presented to the user.
SECURITY
Mobilising a workforce creates new challenges for maintaining corporate security, particularly when BYOD policy is in the mix. Device management, network security and data security are vital, supported by overall security policy dictating what measures are required if a device is lost or stolen. Mobile GIS apps which operate in ‘sometimes connected’ mode will maintain data at rest, meaning that data is downloaded to, and stored, on the mobile device itself. For the utility deploying mobile GIS apps, this will include data related to critical infrastructure, so it is essential that application specific data encryption is applied to protect this information.
UTILITY • MAY 2014 WWW.UTILITYMAGAZINE.COM.AU 68
MAPPING & GIS
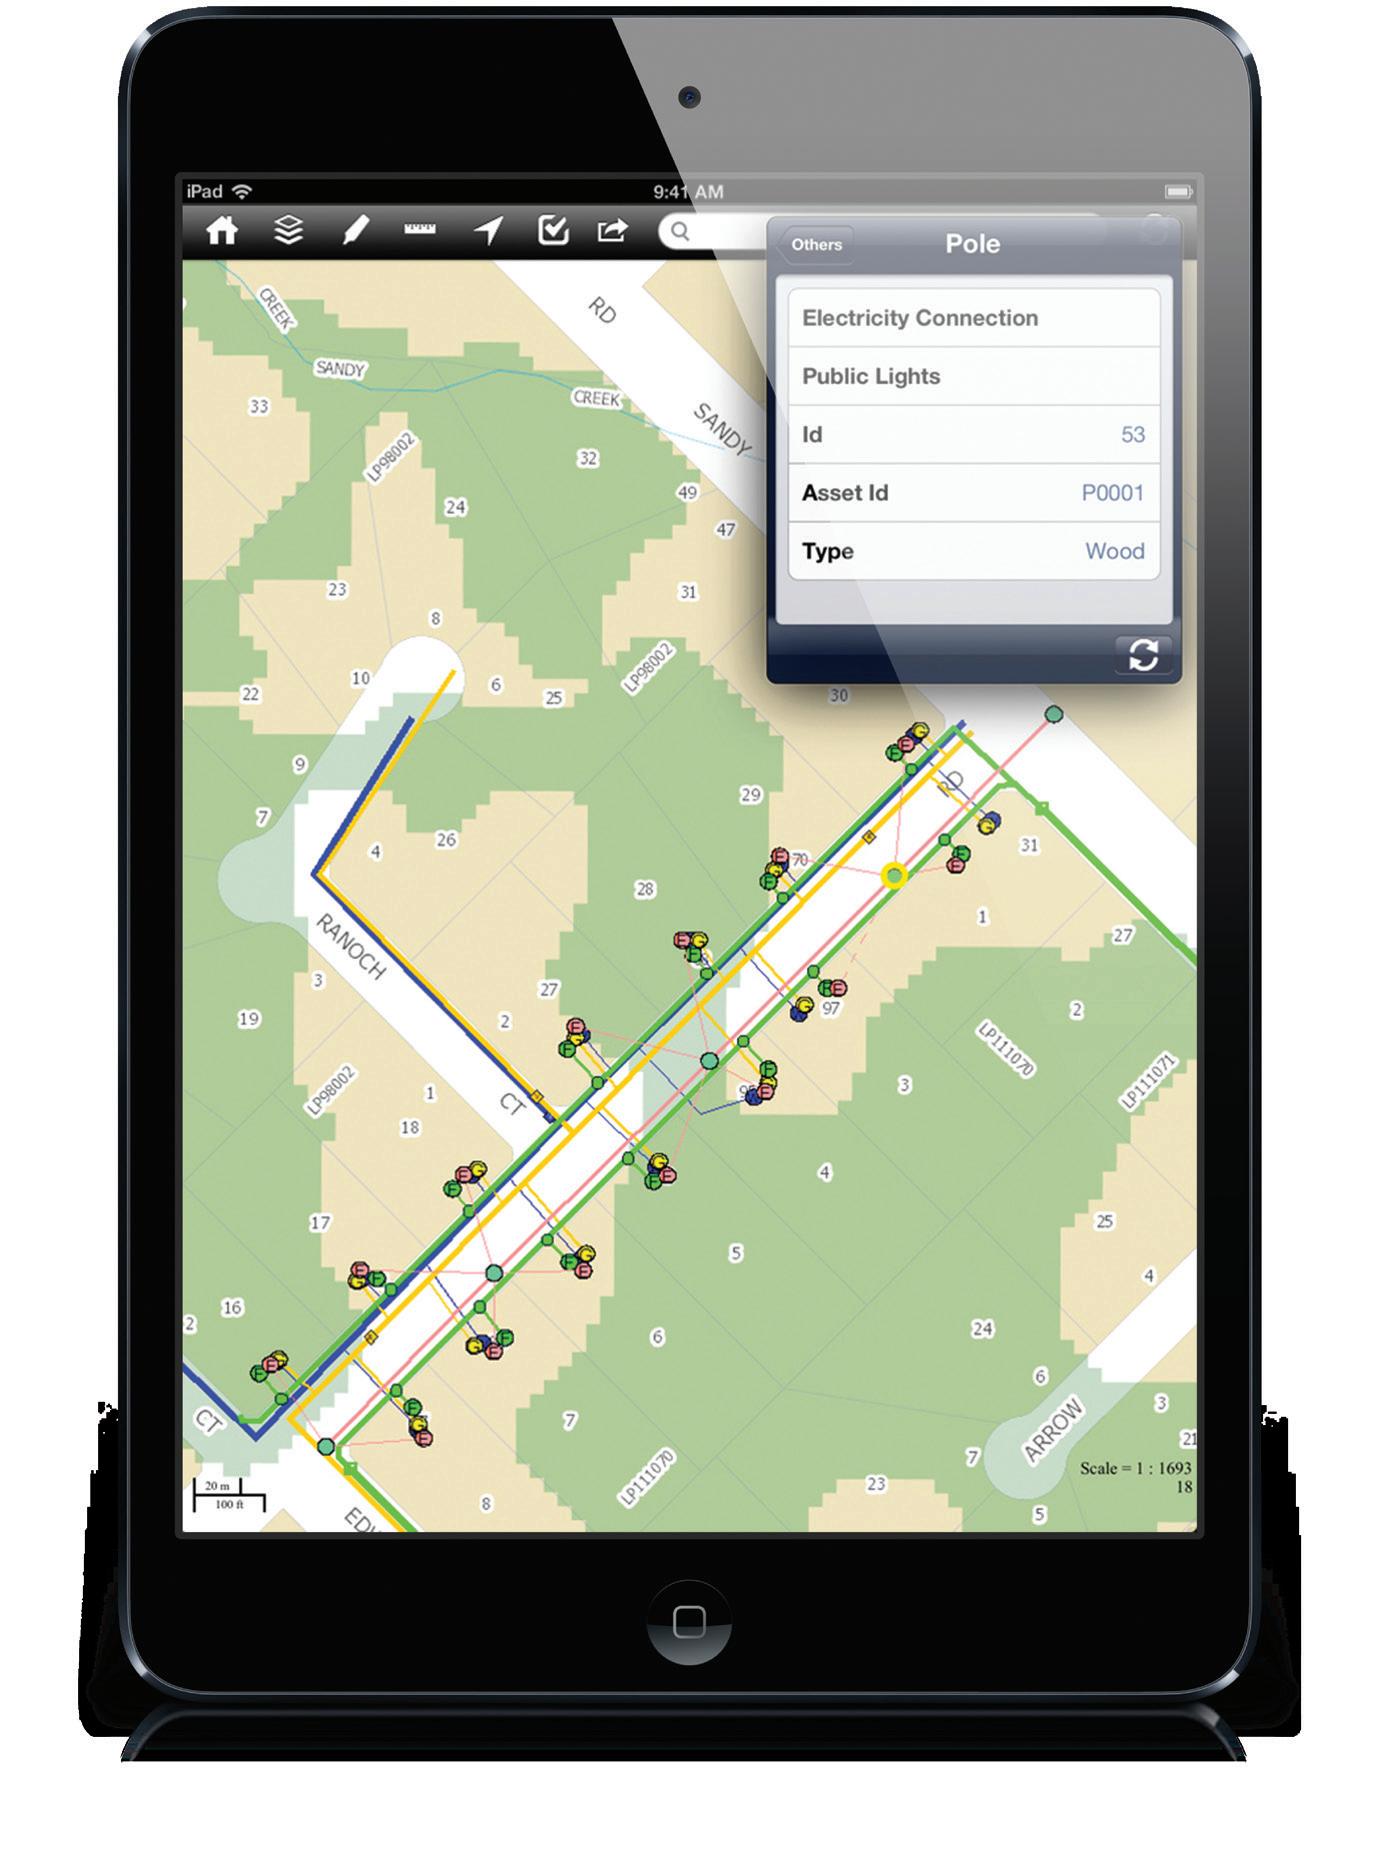


The utility industry relies on expertise from a large and varied range of specialists; from mapping, to drilling, to wastewater treatment, to asset management, to pipe relining, to pipeline integrity, to land access, to risk management...the list goes on. To make the process a little easier, Utility magazine is bringing together experts from various fields to answer all your questions.
Our Global Navigation Satellite Systems (GNSS) Expert
is Evan Bollard. Evan has over 30 years of experience in the specification, implementation and use of GNSS equipment in all types of high accuracy applications both real time and post processed. He is a surveyor by profession and has been involved in the development of major machine control applications from concept through design, prototyping, manufacture and marketing since 1999. He is currently a GNSS Solutions Specialist with GlobalPOS.
Our GNSS column is hoped to provide practical advice on the operational characteristics of various GNSS receivers and their applications in the workplace with a focus on the utility sector. We will try to limit the technical terminology to only that which is necessary to answer the questions we receive. Typically we will be discussing high accuracy GNSS solutions in context.
WHAT IS GNSS?
As this is the first issue for this column - where we are soliciting questions from readers, I thought we could start with a very basic brief outline of what we consider GNSS to be.
Most people know of the existence of the Global Positioning System (GPS) and what a great tool it is. Not as many know about the other Global Navigation Satellite Systems (GNSS), of which GPS is one specific constellation. GPS was developed by the USA. Other countries have developed or are developing their own systems. For many years the Russian Glonass system has been operational and used for applications in many areas around the globe. These two systems are currently the only two fully operational systems with global coverage. Two other global systems are in the
deployment phase. The Chinese Beidou system (currently 14 satellites) and the European Galileo system (currently four satellites).
The Beidou Regional system developed by the Chinese Government for use in China and SE Asia as the second step of the global deployment program is currently operational. Australia has the benefit of this current regional system being available for use in this country as the satellite orbit locations - made up of five Geostationary (GEO), five Inclined Geosynchronous Satellite Orbit (IGSO) and four Medium Earth Orbit (MEO) - provide coverage of the Australian continent. This regional system is being expanded to a global system which is expected to be completed by 2020.
Galileo is the European system being deployed by the European Space Agency (ESA) and has been designed as a global system, although there are only four satellites in orbit at the moment. There are also other regional systems such as the Quazi Zenith Satellite System (QZSS) from Japan, Indian Regional Navigation Satellite System (IRNSS) from India and other Augmentation systems that are in use in various locations around the globe. As we are working in an Australian context we will be providing information on the systems

that are relevant for use here.
So what are the practical applications of this information? For some users GPS alone as a system is good enough and in these cases the status quo can prevail; however, the advantages of using dual constellation or multi-constellation receivers can hopefully be discussed in coming issues based on submitted questions. The different aspects of these various constellations can also provide benefits, say on frequencies available, among other things. We will address a couple of questions that are regularly asked with regards to GNSS.
WHAT IS THE IMPORTANCE OF GNSS TO THE UTILITY SECTOR?
GIS and GNSS are increasingly being used as an integrated part of the management process in the utility sector to improve productivity and reliability. To operate effectively these GIS data sets need an appropriate level of accuracy in the 3D position of features on or in the ground. As well, a measure of the uncertainty of each of these positions is also required to enable effective placement, relocation or other management requirements for the various assets and their associated data. GNSS is one tool that can effectively provide 3D positions
UTILITY • MAY 2014 WWW.UTILITYMAGAZINE.COM.AU 70
in a homogeneous reference frame for long-term locational accuracy for very large scale projects down to small job sites, both in the field and interactively with the office. It is less commonly known that GNSS is the most cost-effective form of highly accurate time transfer over short or long distances. This can assist in network control applications in the electricity sector or in communications networks used by all utility sectors.
High quality locational information on a consistent datum can also assist in the transfer of information databases between utilities in order to, among other things, minimise problems associated with asset disturbance because “we didn’t know it was there.” GNSS facilitates these capabilities in a cost effective and productive manner.
WHAT CAN A GNSS RECEIVER BE USED FOR?
Generally speaking this is covered by the acronym PNT (Position, Navigation and Timing). Depending on the application it is usually one or more of these outputs that is required to be generated. This data is usually integrated with other sensors or data to serve the desired purpose. It can be used to map existing features or topography though to being the basis for machine control in construction or the basis for timing in network synchronisation. Depending on methodology adopted, positions at the millimetre level and timing at the ten nanosecond or better are readily achievable.
WHAT TYPE OF RECEIVER SHOULD I USE?
From an application point of view it is necessary to consider what accuracy is required from the results and what productivity level is acceptable for the application. GNSS receivers come in many forms and many things determine their performance. Currently, using small receiver chips embedded in consumer devices such as smartphones can be very handy for navigation to get to site, but they will not be able to identify the location of previously mapped buried services. For these types of applications ,what can be termed professional grade
receivers are required and it is easy to be able to obtain receivers capable of real time positioning at the centimetre level. But there are many choices to be made – do I need single, dual or even triple frequency capabilities? Do I need dual constellation or multi constellation capabilities? Maybe these are questions you would like answered in future columns.
WHY DOESN’T MY FIELD DATA MATCH UP?
Even though this may at times be considered more of a GIS question, it is very relevant to the operation of any GNSS receiver to ensure the correct datum is selected during use. If it is not set to collect data on the correct datum, or does not define what datum the data was collected on originally, then the data collected may not be as useful as first thought. It is very easy to collect very precise incorrect data. In Australia the geodetic datum is currently GDA94/ MGA94 (Geocentric Datum of Australia 1994/Map Grid of Australia 1994). Even
though this is a geocentric datum it is not dynamic and may not be used by a particular GNSS receiver. Many receivers observe their positions on the ITRF (International Terrestrial Reference Frame) based on the current epoch, and then convert this value to a selected datum such as GDA94 (Lat, long coordinates) and MGA94 (UTM coordinates) based on a set of parameters (published or otherwise) at a specified epoch (ITRF 1992 for GDA94) If the drift of the Australian continent is not taken into account in these receivers by regularly updating these conversion parameters, or by using time derivatives in the setting of these parameters then incorrect results are the outcome. One practical way of ensuring the output is as required is by observing existing published ground control marks to make a comparison between the observed coordinates and the published values. If operating in a ‘local’ coordinate system, these types of checks should also be performed for each job against known values.
Do you have a burning question about GNSS, need a practical answer to a problem you’ve encountered, or even just curious? Then, ask your expert! Send your questions to Evan care of expert@utilitymagazine.com.au
We will be adding new experts on other topics in future issues, if you have any topics you would like to suggest, please also email us at the above address.
WWW.UTILITYMAGAZINE.COM.AU UTILITY • MAY 2014 71
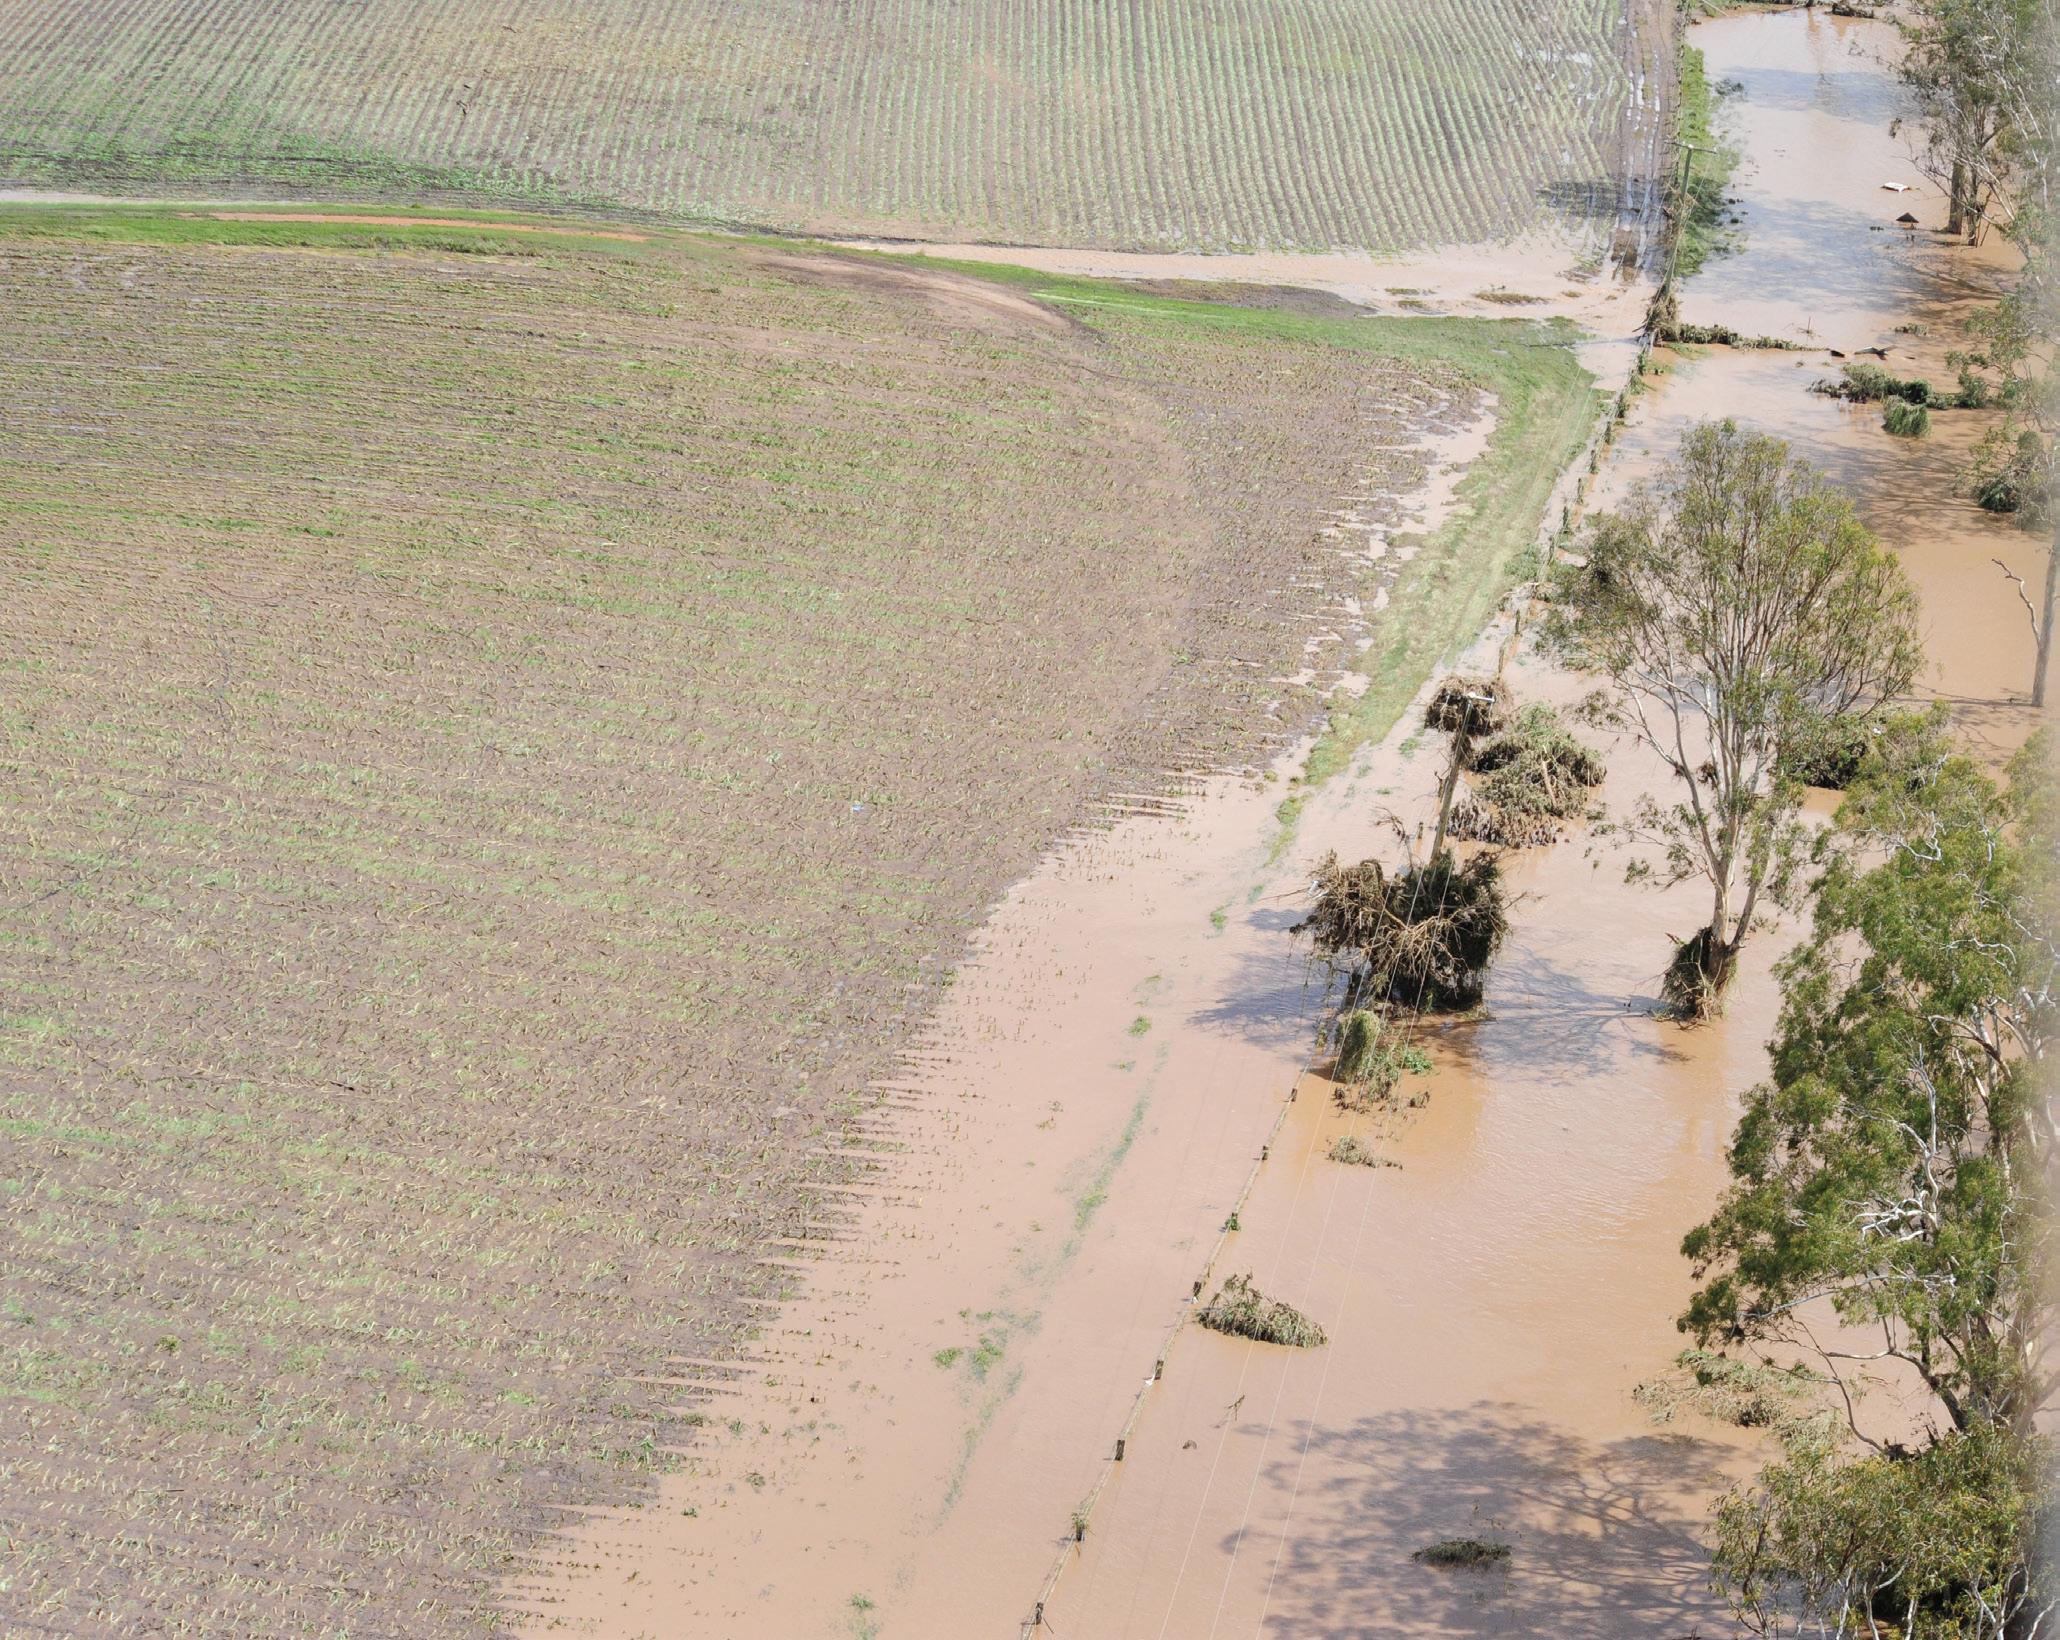
RIGHT ROUTE FINALLY FOUND FOR LOCKYER VALLEY
Delays proved to be a blessing in disguise as they saved a multimillion dollar project from washing away during Queensland’s devastating 2011 floods.
Energex was in the process of three major multi-staged projects worth $25 million to upgrade the power supply and benefit more than 10,000 homes across the Lockyer Valley in South East Queensland. A combination of glitches, however, pushed out the original timelines for the long-awaited upgrades.
Planners had to go back to the drawing board when they could not get past the first hurdle of land access for part of their 33kV overhead powerline corridor. After coming up with an alternate route for the lines, nearby Grantham was decimated by a massive wall of water.
While most of Queensland was severely affected in the 2011 floods, the Lockyer Valley in the south-east was one of the areas hardest hit, with 17 deaths recorded and hundreds
left homeless after their homes were wiped out.
Some of the crucial areas to connect were Lockrose, Tarampa, Lowood and Fernvale. The upgrade would ensure its future power security in times of extreme temperatures or severe storms through three substation upgrades and new powerlines.
However, one of the key infrastructure areas had been submerged. Designers once again went back to the drawing board.
Energex Senior Project Manager
Leslie Yeow said the prior hold-up over land access was a blessing in disguise as the company had not started construction.
“We had planned to cross the Brisbane River twice in the vicinity of Lowood Substation with 33kV overhead powerlines to connect the
Lowood Substation to the future Fernvale 33/11kV Substation, but we had to rethink our design as Wivenhoe Pocket was taken out,” Mr Yeow said.
Energex chose an alternate route, part of which included the historic Brisbane Valley Rail Trail. The Trail was a disused rail line that proved to be a popular local recreational tourist attraction since its transformation upon closure of the line in 1989. Energex had to adapt its alternate route to minimise disruption to the Trail’s visual aspects and the physical route itself.
The upgrade progressed until designers found that along one side of the trail ran sewage pipes, impacting on the digging that was required to erect power poles. In addition, some of the drainage culverts along the trail were not designed to bear the weight of the trucks required in the construction.
UTILITY • MAY 2014 WWW.UTILITYMAGAZINE.COM.AU 72
PROJECTS
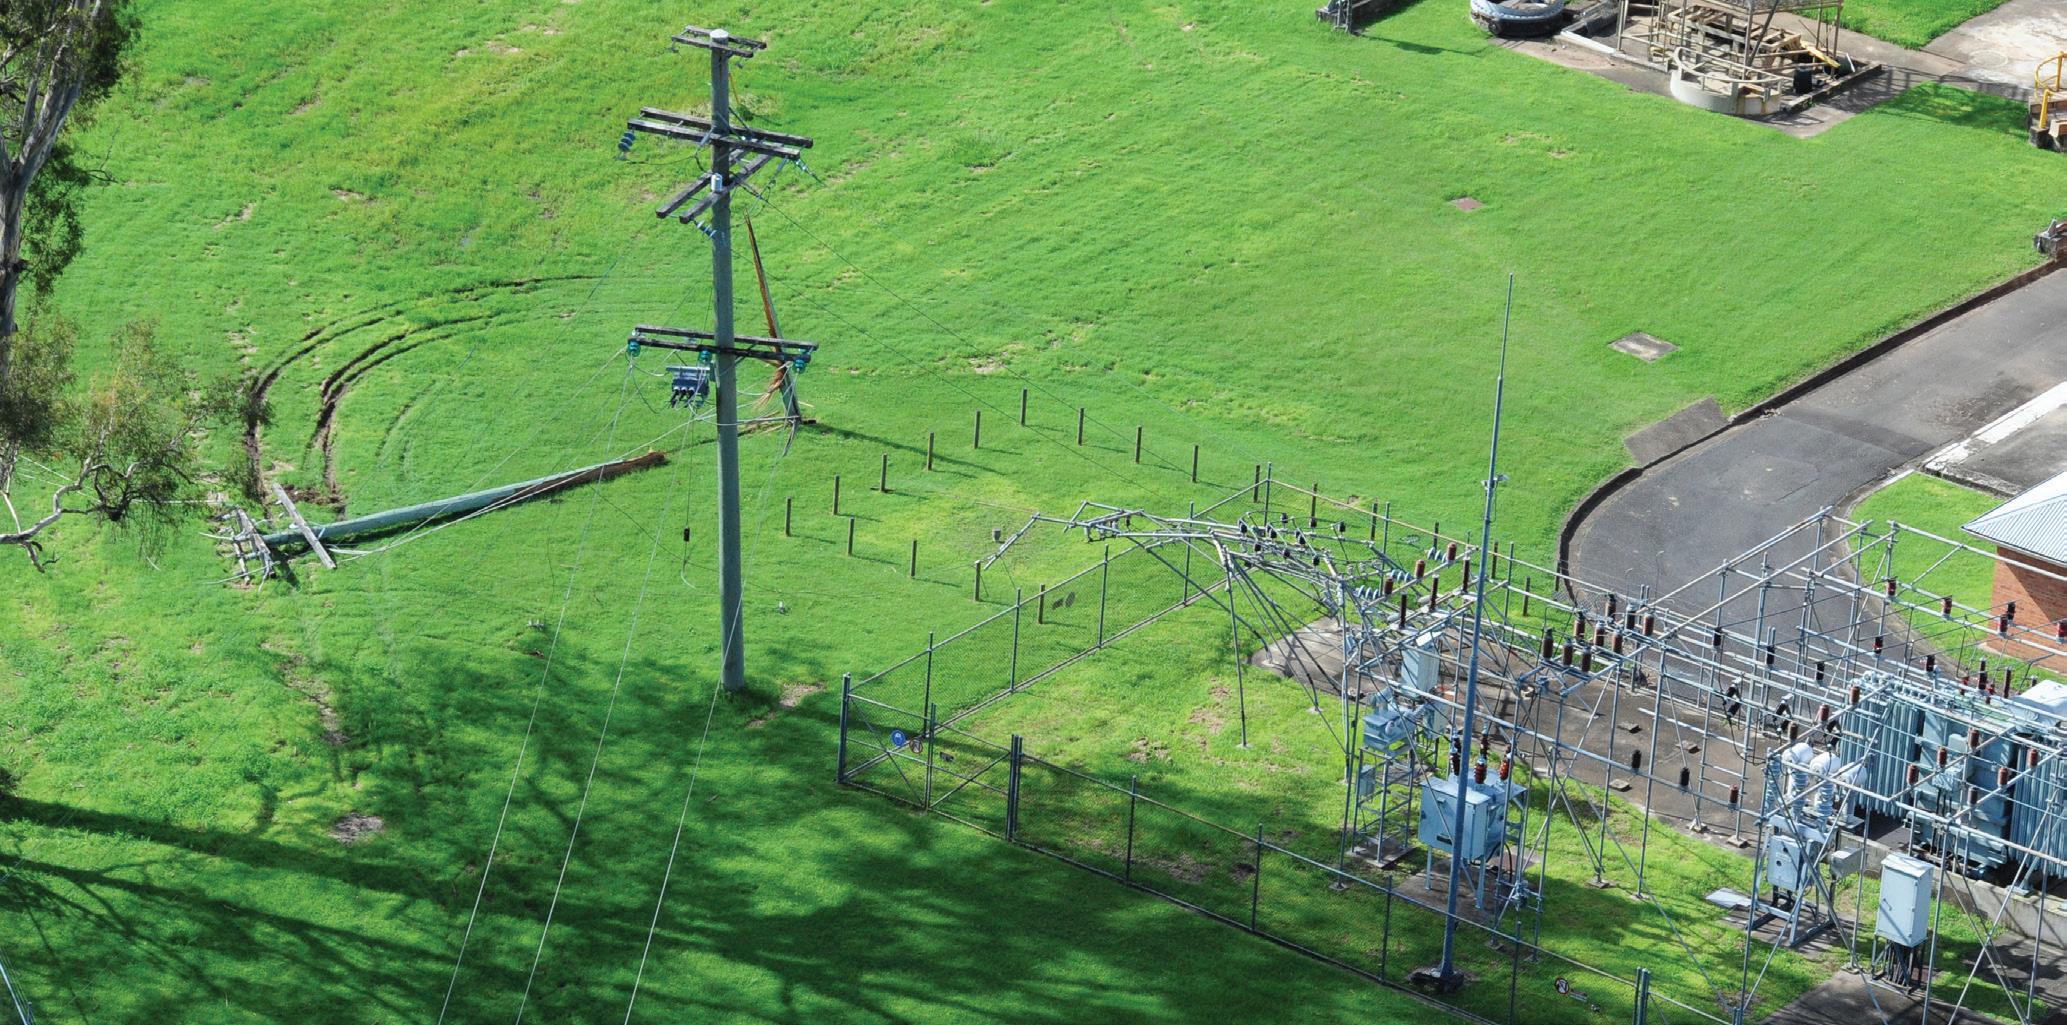
Once again designers went back to the drawing board, devising more solutions to achieve the vital upgrade through detailed design to ensure the project was delivered.
In all, across the regional community, more than 30km of new 33,000 volt powerlines were installed and will operate in conjunction with substations upgraded in Lowood, Tarampa and Lockrose.
At the same time, across the other side of the Lockyer Valley, Energex was also working on the $12.3 million Glenore Grove substation and powerline upgrade to bolster power to more than 6,000 homes.
“The Glenore Grove substation upgrade saw equipment that had served the community for more than 50 years replaced with the most up-to-date electrical infrastructure,” Mr Yeow said.
“The substation improvements also allowed Energex to directly connect it to Laidley substation via a new powerline which, in most cases, will allow our crews to get the lights on faster after storm damage because they’ll be able to divert power between both facilities.”
By the end of 2013, the Lockyer Valley, after being devastated by floods just two years before, has newly upgraded substations and new powerlines to bolster the power supply of more than 10,000 homes.
WWW.UTILITYMAGAZINE.COM.AU UTILITY • MAY 2014 73
PROJECTS
DAMAGE CAUSED TO THE ELECTRICITY NETWORK BY THE 2011 FLOODS
COLLABORATIVE APPROACH SEES FLOOD PROJECT COMPLETED
The Hattah Lakes wetland no longer floods as regularly as it once did, posing a threat to the area’s ecological balance. A vast project to create artificial flooding undertaken to solve this issue was threatened when rivers rose to 40 year levels during construction, but a collaborative approach between the stakeholders and contractors ensured that the job was completed on time.

Hattah Lakes is an extensive wetland complex covering approximately 13,000 ha within the 48,000 ha Hattah-Kulkyne National Park. It is located in Victoria on the River Murray between Robinvale and Mildura. The key threat to the environmental values of the Hattah Lakes is the reduction in the frequency and duration of flooding, caused by the diversion and regulation of flow upstream. There has also been a minor shift in the seasonality of flows with the majority of peaks now occurring in August, one month later than under pre-development conditions. The lakes are now rarely filled and floodplain vegetation, which depends on flooding, is in poor health.
In 2010, a briefing paper on the economic value of Australian wetlands was commissioned by the Conservation Foundation. This paper found that by applying the concept of Total Economic Value (TEV) to the Hattah Wetlands asset, the range of attributable values (‘direct use’, ‘indirect use’, ‘option’ and existence’) to the asset including ecosystem services totaled over $14.5 million per annum.
Goulburn-Murray Rural Water
Corporation (G-MW), the statutory corporation that manages resources for northern Victorian water systems identified the need for works as part of The Living Murray (TLM) Hattah Lakes Environmental Flows Project to address deficiencies related to environmental flows in the Hattah Lakes and improve the ecological condition of the Hattah Lakes as well as protect the economic value it holds for the local region and Victoria in general.
The works proposed included lowering sills in Chalka Creek to increase the frequency of natural flows, constructing a series of regulators and stop banks on the floodplain to retain water; and constructing a permanent pumping station at the mouth of Chalka Creek to top-up natural floods and fill the lakes during long dry spells. The intention is that these works will improve the ecological condition of the lakes system by increasing frequency, duration and extent of wetland and floodplain inundation. Ultimately the Messenger Creek Pump Station can supply 1050 mega litres of water every day (12,000 litres per second) into the wetland system.
Comdain Infrastructure was awarded the prime contract for this project which included complete project management of the works, survey, all site supervision, and construction works (earth, road, concrete, river and mechanical), mobilisation and demobilisation. After award Comdain also assumed the contract responsibility for the construction of the required 5.2km 22,000 volt underground electricity supply to the Messenger Pump Station ensuring the continuity of the overall project.

The total value of the project was $19M (ex-GST) with plant and labour contributing over $7M of the total and the specialised axial flow pumps for the Messenger Regulator over $2M of the total.
Overall the scope of works delivered by Comdain’s project group included site mobilisation and site clearing including grubbing of trees, setting out of works and construction of all works,
UTILITY • MAY 2014 WWW.UTILITYMAGAZINE.COM.AU 74
PROJECTS

including but not limited to:
Messengers Works Regulator;
Messengers Works Pump Station which includes seven 300kw, 32 metres long two-stage axial flow and driven pumps;
Messengers Works Motor Control and Telemetry Room which includes pump variable speed drives, local Human Machine Interface control and telemetry/WAN interface to GMW’s flow office in Mildura;
Lake Kramen Works comprising a pipeline and regulator structure;
Little Lake Hattah Regulator Refurbishment;
Chalka Creek Works comprising Lowering of sills at various sites and rock-lined fishway channels at the confluence of the Murray;
Breakout works comprising a stop bank (levee) which replaces the existing road;
Cantala, Oateys and Bitterang Works comprising variously a Regulator, Stop Bank and Access Tracks; and Temporary works, as required for the construction of the works including: Set down areas at Messengers, Cantala, and Oateys;
Site office accommodation/facilities for both the Contractor and G-MW Borrow areas (for soil deposition) at some or all of Orchard Partners, Kulkyne and Bitterang; Temporary Concrete Batch Plant site; Access track maintenance and passing bays for construction vehicles
The remote area, harsh climate and controls needed to mitigate damage to environment and cultural heritage values required a comprehensively planned construction methodology coordinated with multiple stakeholders. Scheduled delivery duration was just over 10-months (18 October 2012) from contract award (1 December 2011) but the highest recorded river level increases in 40-years threatened this already tight delivery time-frame. The effective use of river level modeling and prompt decision making by the Comdain Project Team around mobilisation and protection works for the site ensured the project reached practical completion ahead of time and on-budget.
A collaborative approach to every possible element of this project and its works has been a key reason for its outstanding success:
According to Comdain Infrastructure Managing Director Peter Coen, “Comdain has been very proud and grateful to work with stakeholders ranging from Goulburn Murray Water and Murray Darling Basin Authority through to indigenous land owner representatives, environmental groups, government agencies and the broad range of users of the lakes area.”
Tony Morse GM Assets MDBA commended Comdain Infrastructure writing “I would like to thank Comdain on their professionalism on managing the Hattah Lakes Environmental Flows project to meet project schedule, come in under budget, respecting indigenous people and their cultural heritage, respecting the environment and building strong relationships.”
Andrew Reynolds Project Director GMW expressed their gratitude writing, “constructing these large scale infrastructure works in the environmentally sensitive Hattah Kulkyne National Park presented unique sets of risks and challenges that Comdain’s diligent and systematic approach to managing them contributed significantly to the successful deliver of this project.”
WWW.UTILITYMAGAZINE.COM.AU UTILITY • MAY 2014 75
PROJECTS
WATER CORPORATION OF WESTERN AUSTRALIA UTILITY IN PROFILE
WHAT IS UNIQUE ABOUT WATER CORPORATION?
We provide water, wastewater and drainage to more than 2.2 million customers across an area of more than 2.6 million square kilometres, which makes us one of the largest water utilities in the world in terms of the geographical area we service.
PROVIDING SUSTAINABLE WATER SERVICES IN A DRYING CLIMATE
In the early 2000s we began to consider the possibility that we could no longer rely on rainfall for Perth water supplies. We believe we have successfully moved Perth’s water supply away from a reliance on dams through a three-pronged approach that includes reducing water use, developing new
sources and increasing water recycling. This is an ongoing challenge that will require continued work over the coming years as we continue to adapt to the changing climate.
Last year, Perth’s dams only received 80.5 billion litres of inflow. To put this into perspective – we supply around 300 billion litres of water to customers connected to the Integrated Water

UTILITY • MAY 2014 WWW.UTILITYMAGAZINE.COM.AU 76

Supply Scheme (IWSS), so this is less than a third of what our customers use.
REDUCING WATER USE
Over the last ten years our Perth customers have reduced their per person water use from 191 kilolitres to 132 kilolitres last financial year. We continue to work with our business and industrial customers to help reduce their water use. Last year we saved over 100 billion litres of water in Perth through a range of water efficiency initiatives introduced over the last decade.
DEVELOPING NEW SOURCES
Seawater desalination is the cornerstone of the water supply to the IWSS. That said, the work of our customers to reduce their water use has also been pivotal – over the last decade water saving efforts have contributed to 100 billion litres of water saved each year.
We have also invested in groundwater replenishment as Perth’s next climate independent water source. Groundwater replenishment is the process where treated wastewater goes through an advanced water treatment process to drinking water standards and is then recharged back into groundwater supplies for future use as drinking water.
The first stage of groundwater replenishment will deliver seven billion litres of water each year and is planned for completion in June 2016. Stages
two and three will be built to meet population growth and water supply demands and will supply up to 28 billion litres of water each year.
INCREASING WATER RECYCLING
Over the past 10 years the volume of recycled wastewater has increased by almost 75 per cent across the State. In Perth, this includes groundwater replenishment, irrigation of parks and ovals with recycled water and providing fit-for-purpose water for industrial use at the Kwinana Water Recycling Plant.
FRESH WATER THINKING
We’re continuing to work with our customers to deliver and encourage Fresh Water Thinking. We’re constantly looking for new ways to provide better service for our customers.
Our strong customer focus has seen the introduction of two-monthly billing and our self-service website, My Water
Billing every two months aims to make payment more manageable for customers by spreading annual costs across six bills, instead of larger accounts distributed less often. Issuing smaller, more manageable bills more frequently will also allow customers to track their water use, detect leaks earlier and assess their water efficiency efforts sooner.
My Water allows customers to view and pay their bills online, update personal details, view water use, set up
direct debits from their bank account or credit card and arrange for paperless billing. We’ll continue to make enhancements to the website in order to incorporate customer feedback.
WHAT TYPE OF OCCUPATIONS WILL WATER CORPORATION NEED MORE OF IN FIVE YEARS TIME?
One area of our business that continues to grow is our team of digital specialists. This team works to ensure our customer focus is delivered through our online mediums – including social media and our website.
This is a growing area with more and more customers taking to social media to ask questions and find out more about our business.
WHAT WILL WATER CORPORATION LOOK LIKE IN TEN YEARS?
We’ll continue to work towards targets set in our 50-year plan, Water Forever to ensure we deliver the best service for our 2.2 million customers across Western Australia.
CAN YOU SUM UP WATER CORPORATION IN THREE WORDS?
Fresh Water Thinking.
WWW.UTILITYMAGAZINE.COM.AU UTILITY • MAY 2014 77
PRACTICAL GROUND-PENETRATING RADAR FEATURES WITH THE NEW OPERA DUO EXPLAINED
IDS has now released its new Opera DUO to the market.
GPR is a vital piece of equipment in a locators arsenal and gives the operator more information and is a useful tool when used with EMF and other types of locating technology. The new DUO uses proven Dual frequency technology that offers better accuracy to standard single channel units.
The IDS Dual frequency units have two frequencies; a high frequency 700 MHz and a lower 250 MHz combined antenna. Using a high frequency antenna gives the operator more accuracy enabling them to locate the smaller targets in the shallow depths that single frequency units could sometimes miss. The lower frequency will detect deeper and work
better in more difficult soil conditions that GPR units regularly come across.
Onboard GPS units do not offer the accuracy required when users want to accurately map an area. The Opera DUO offers new acquisitions software that allows users to use superior external GPS units and allows them to transfer information across to AutoCAD.
Another innovative feature is the optional spray paint marker. This system is mounted on the antenna and is incorporated into the acquisition software so a user can simple mark when they detect a

target on the display. No more bad-back from bending down and marking the ground using conventional spray cans. Access Detection will be doing some special introductory pricing for the first five units and will have roadshows in Brisbane, Sydney and Melbourne.
CARLSON SOFTWARE AVAILABLE FROM GLOBALPOS
Carlson Software is built on both AutoCAD® and IntelliCAD® (built-in), allowing its users to choose their CAD platform.
Carlson Software currently runs on AutoCAD and AutoCAD Map versions 20002014. From data collection to design and drafting, to estimating, through stakeout, to machine control, you’ll find complete, interactive software solutions with Carlson, allowing you to skip rework and data conversions. Carlson provides industry-leading breakthrough features across land surveying, GIS, civil engineering, construction and mining to enable its users to do more, do it better and in less time.
Customer input leads directly to new state-of-the-art features. Carlson Software’s independence fosters both its creativity and innovation and that of users. Carlson is free to focus on its customers to provide better, constantly improved software that ‘does more’. Carlson’s product line provides full data interoperability through the use of dozens of built-in drivers, including full support of the industry standard LandXML format for civil data exchange.
Support from Carlson is available via email, discussion groups and webcasts.
There is no product ‘retirement’ as all versions of all products continue to be serviced. Each new release of the product line at Carlson Software provides new customer-driven features. Carlson customers are allowed to choose to upgrade based solely on the merits of the software’s new features.
These are some of the reasons that GlobalPOS is pleased to be able to provide the Carlson Software in the Australian marketplace.
For sales enquiries please contact GlobalPOS on 1800 636 627 or email sales@globalpos.com.au.

78 UTILITY • MAY 2014 WWW.UTILITYMAGAZINE.COM.AU
Advertorial
SHOWCASE
visit our website at www.accessdetection.com.au for dates and further information on the unit.
Please


SUBSCRIBE FREE TODAY www.utilitymagazine.com.au/subscribe/ PRINT MAGAZINE ONLINE VERSION UTILITY E-NEWS SUBSCRIPTION INCLUDES HURRY! FREE OFFER WONT LAST
EDITORIAL SCHEDULE
AUGUST 2014
NOVEMBER 2014
MAJOR
CATHODIC PROTECTION
LEAK DETECTION
EQUIPMENT & MACHINERY
PUMPS, VALVES, COMPRESSORS
AND FILTERS
EQUIPMENT RENTAL
ATTACHMENTS AND BUCKETS
HORIZONTAL DIRECTIONAL
DRILLING (HDD) FEBRUARY
2015
MAJOR
EMBEDDED
MAY 2015


80 UTILITY • MAY 2014 WWW.UTILITYMAGAZINE.COM.AU
MAJOR FEATURES DEMAND MANAGEMENT ENERGY NETWORKS AND DISTRIBUTION COAL SEAM GAS WATER RECYCLING SPECIAL FOCUS INSPECTION, CCTV AND CONDITION ASSESSMENT MICROTUNNELLING MAPPING, GIS & SURVEYING EQUIPMENT & MACHINERY SMART METERS COMMUNICATIONS DEVICES TRENCHERS
FEATURES STORMWATER RENEWABLES ASSET MANAGEMENT RETAIL, BILLING AND CRM SPECIAL FOCUS SCADA, CONTROL SYSTEMS, IT AND SOFTWARE WASTEWATER TREATMENT PIPE RELINING DRAIN CLEANING EQUIPMENT & MACHINERY PIPE & CONDUIT CABLES EXCAVATORS AND SKID STEER LOADERS VACUUM EXCAVATION AND NON-DESTRUCTIVE DIGGING
MAJOR
FEATURES DESALINATION GAS PIPELINES SMART GRIDS ENERGY EFFICIENCY SPECIAL FOCUS LAND ACCESS AND RIGHT-OF-WAY TRANSFORMERS AND SUSBSTATIONS PIPELINE INTEGRITY, COATINGS,
FEATURES SOLAR DAMS SAFETY SUSTAINABILITY CONTRACTS AND RISK SPECIAL FOCUS UTILITY LOCATION TESTING AND MEASUREMENT
REHABILITATION
SEWER
NETWORKS
GENERATION IRRIGATION EQUIPMENT & MACHINERY SWITCHGEAR LASER GRADING LARGE EXCAVATORS AND TRUCKS Access Detection 9 ADITC 43 Austeck OBC Edge Underground 49 EnerNOC 15 GlobalPOS 19 LatLonGO 69 National SCADA conference IBC Panorama Antennas 27 Select Solutions IFC Stockton Drilling Services 39 Streamline Drains & Pipelines 7 Taylors 61 Total Drain Cleaning 2-3 Utility subscriptions 79 Vermeer 17 Advertisers’ index
DISTRIBUTED
